
Fermi Inc. faces heightened pressure as regulatory investigations dominate sentiment, with stocks have been trading down by -7.94 percent.
Key Takeaways
- FRMI has dropped from the $3.70 area to near $2.00, signaling heavy selling pressure and a broken short-term uptrend.
- Intraday action shows tight consolidation around $2.03, hinting at a possible base but also weak buying interest.
- Fermi Inc. reported a quarterly net loss of about $25.8M and negative free cash flow near $233.6M, underscoring serious cash burn.
- The balance sheet shows only about $91.7M in current assets versus $149.7M in current liabilities, a red flag for liquidity.
- Traders are tracking FRMI for potential short-term bounces, but the bigger picture favors disciplined risk management.
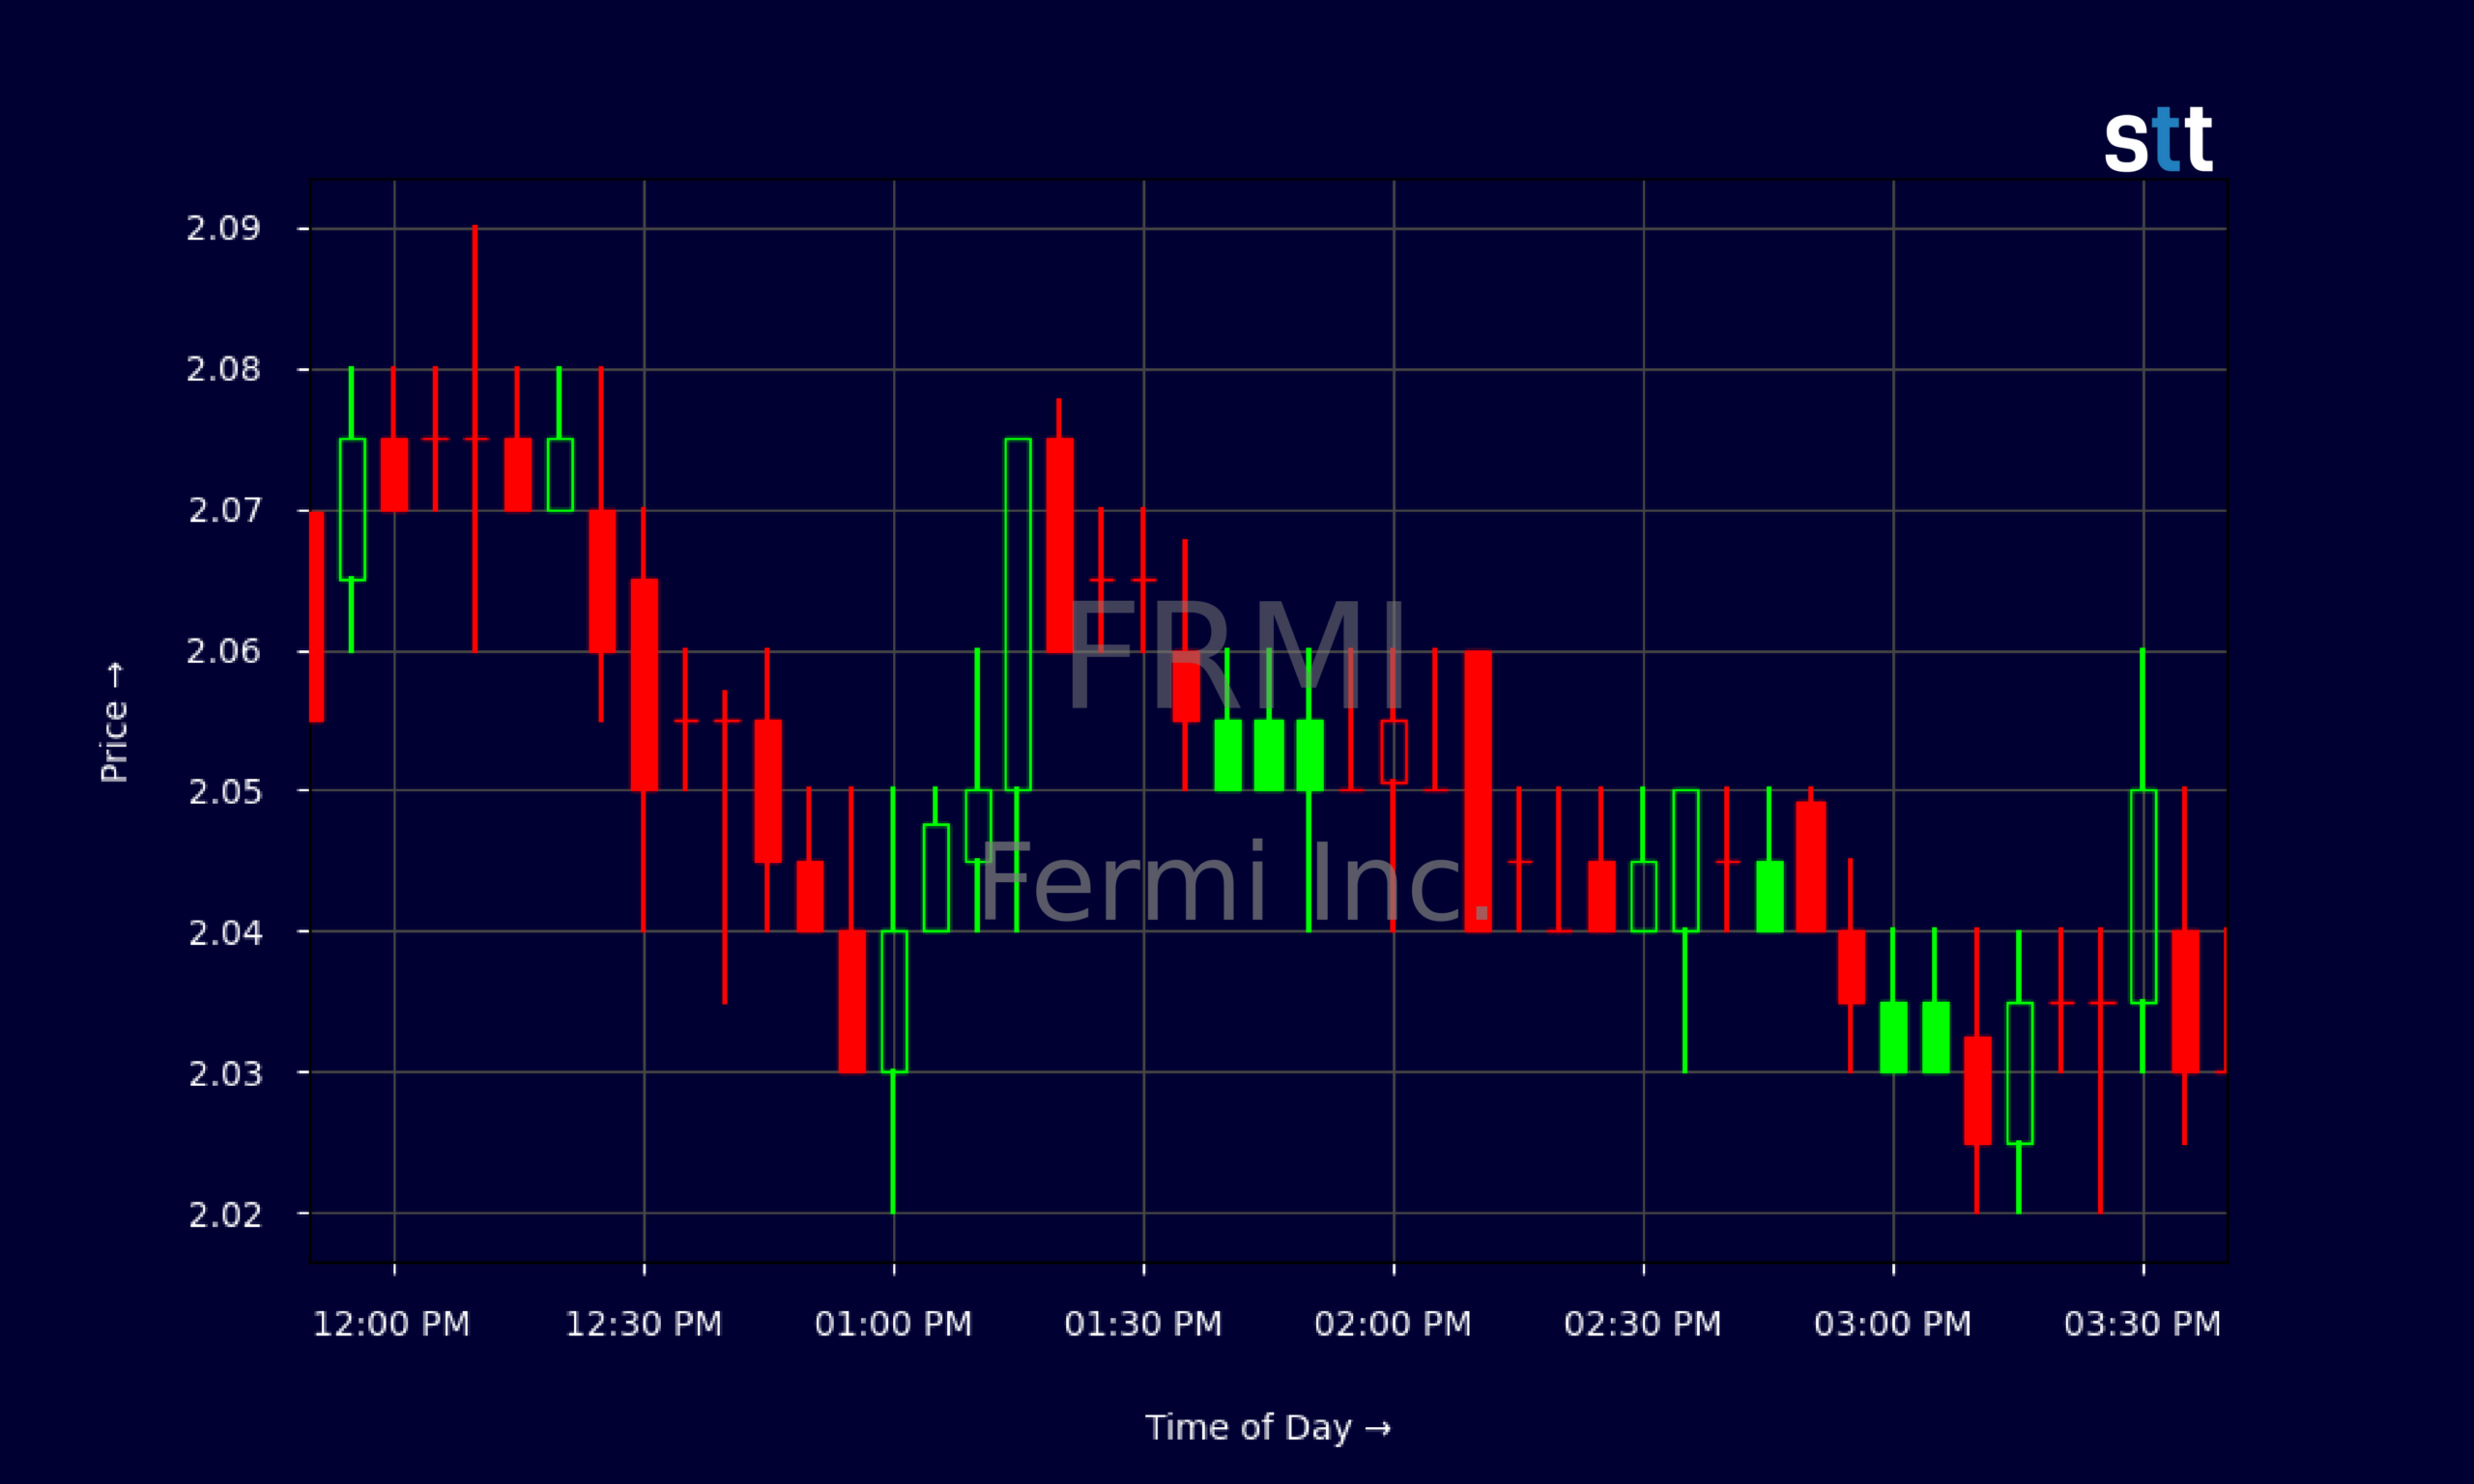
Live Update At 15:48:34 EST: On Tuesday, November 03, 2026 Fermi Inc. stock [NASDAQ: FRMI] is trending down by -7.94%! Discover the key drivers behind this movement as well as our expert analysis in the detailed breakdown below.
Quick Financial Overview
FRMI, the ticker for Fermi Inc., is trading like a textbook cash-burning story with technical damage to match. On the daily chart, FRMI rolled over from a recent high near $3.72 and has slid to around $2.03. That’s a sharp pullback, and it tells traders that momentum flipped from strong buying to sustained selling in just a few weeks.
Under the hood, Fermi Inc. is not throwing off cash; it is consuming it. The latest quarterly report shows a net loss of about $25.8M and operating cash flow around negative $48.7M. Free cash flow is even worse at roughly negative $233.6M, driven by heavy capital spending of about $185.0M.
More Breaking News
- EPAM Stock Climbs As Wall Street Lifts Price Targets
- AMZN Stock Rallies As AWS AI Boom Fuels Massive Capex Bet
- AEHL Stock Pulls Back As Volatility Grips Low-Float Name
- Intel Stock Plunges As Weak Outlook Triggers Legal Scrutiny
FRMI’s balance sheet highlights the pressure. Fermi Inc. has only about $91.7M in current assets against roughly $149.7M in current liabilities, leaving working capital deep in the red. A current ratio near 0.3 and quick ratio near 0.1 are classic signs of tight liquidity. For active traders, that mix of fast cash burn and weak short-term cushion often leads to volatile swings and sharp trend breaks.
Why Traders Are Watching FRMI’s Price Compression
FRMI has gone from a momentum name to a compression play. Just weeks ago, Fermi Inc. was trading in the mid-$3s and even spiked to about $4.06. Now the stock is sitting almost cut in half from those highs, closing near $2.03 on the latest day. That breakdown through the $3.00 and then $2.50 zones shows that each prior support turned into resistance.
The intraday five-minute chart tells the rest of the story. Early in the session, FRMI opened above $2.20 and quickly lost that level, sliding into the low $2.10s and then under $2.10. From late morning into the close, Fermi Inc. basically chopped between $2.02 and $2.08. The range tightened, volume likely thinned, and the price settled right near the low of the day. That is classic compression after a trend down.
For short-term traders, this kind of tight coil matters. FRMI can stage quick relief bounces if shorts lock in profits or day traders jump on any push back toward $2.20–$2.30. But the broader daily trend for Fermi Inc. is down, and the fundamentals back that up. Negative returns on assets near -38% and a price-to-book ratio around 2.13 tell traders they are paying a premium for a company that is not yet profitable.
The enterprise value near $2.45B, stacked against heavy cash burn and only 35 employees, suggests Fermi Inc. is a capital-intensive, story-driven name. When that story cools off, FRMI tends to trade more on technical levels than on improving numbers. That is why disciplined chart reading is critical here.
Conclusion
FRMI is the type of stock that attracts active traders but punishes anyone who ignores risk. Fermi Inc. is burning through cash, with roughly negative $233.6M in free cash flow in the latest quarter and working capital of about negative $57.9M. At the same time, the chart has shifted from breakout to breakdown, with FRMI falling from above $3.70 to near $2.00 and closing at the low of the day.
That combination usually leads to one of two outcomes in the short term: sharp, tradeable bounces for nimble traders, or continued grinding lower as bagholders slowly give up. Fermi Inc. is sitting in that zone now. The tight intraday range around $2.03 shows that both bulls and bears are waiting for the next move.
For those studying FRMI, the lesson is bigger than one ticker. This is what an aggressive growth, cash-burning story looks like when momentum cools. As Tim Sykes loves to remind traders, “The market doesn’t care about your opinion, only your risk management.” As Tim Bohen, lead trainer with StocksToTrade says, “Time and experience have taught me that missed opportunities are part of the game. There’s always another setup around the corner.” With Fermi Inc., the message is clear: treat it as a trading vehicle, respect the levels, and always, always cut losses fast. This analysis is for educational and research purposes only, not a recommendation to buy or sell FRMI.
This is stock news, not investment advice. StocksToTrade News delivers real-time stock market updates tailored to highlight the key catalysts driving short-term price movements. Our coverage is designed for active traders and investors who thrive in fast-moving markets, with a focus on volatile sectors like penny stocks, AI stocks, Robinhood stocks and other momentum plays. From earnings reports and FDA approvals to mergers, new contracts, and unusual trading volume, we break down the events that can spark significant price action.
Looking to level up your trading game? Explore StocksToTrade, the ultimate platform for traders. With powerful tools designed for swing and day trading, integrated news scanning, and even social media monitoring, StocksToTrade keeps you one step ahead.
Check out our quick startup guide for new traders!
- How to Read Stock Charts: A Guide for Beginners
- Trading Plan: 6 Steps to Create One
- How To Create a Stock Watchlist
Ready to build your watchlists? Check out these curated lists:
Once your watchlist is set, take the next step and trade with confidence using StocksToTrade’s robust platform. Don’t miss out — grab your 14-day trial for just $7 and experience the edge you need to thrive in today’s fast-paced markets.