
Getting in stocks that aren’t in a confirmed uptrend just wastes your time and money and leaves you frustrated.
And if you’re under the PDT rule, you waste one of your precious-few day trades in a stock that goes nowhere.
To grow your account you need to focus on trends…
As momentum day traders we want to join trends to the upside, ride the move, and then exit and move on to the next.
And you want to avoid stocks that are stuck in a channel and going sideways on the chart.
That just bores you to death making you exit the trade for break even or a small loss.
And when the stock does make its breakout move, you’re stuck on the sidelines with no day trades left forcing you to miss out on an opportunity.
So to cut those wasteful trades out of your life, I’m going to explain what a trend is, I’ll show you how to spot it, and give an example of why these are the patterns to focus on.
What Is a Trend?
A trend is an overall direction a stock is moving.
If you’re a long-biased trader you want to look for up-trending stocks. If you short-sell, you want to look for down-trending stocks.
On the daily chart, an uptrend looks like this…
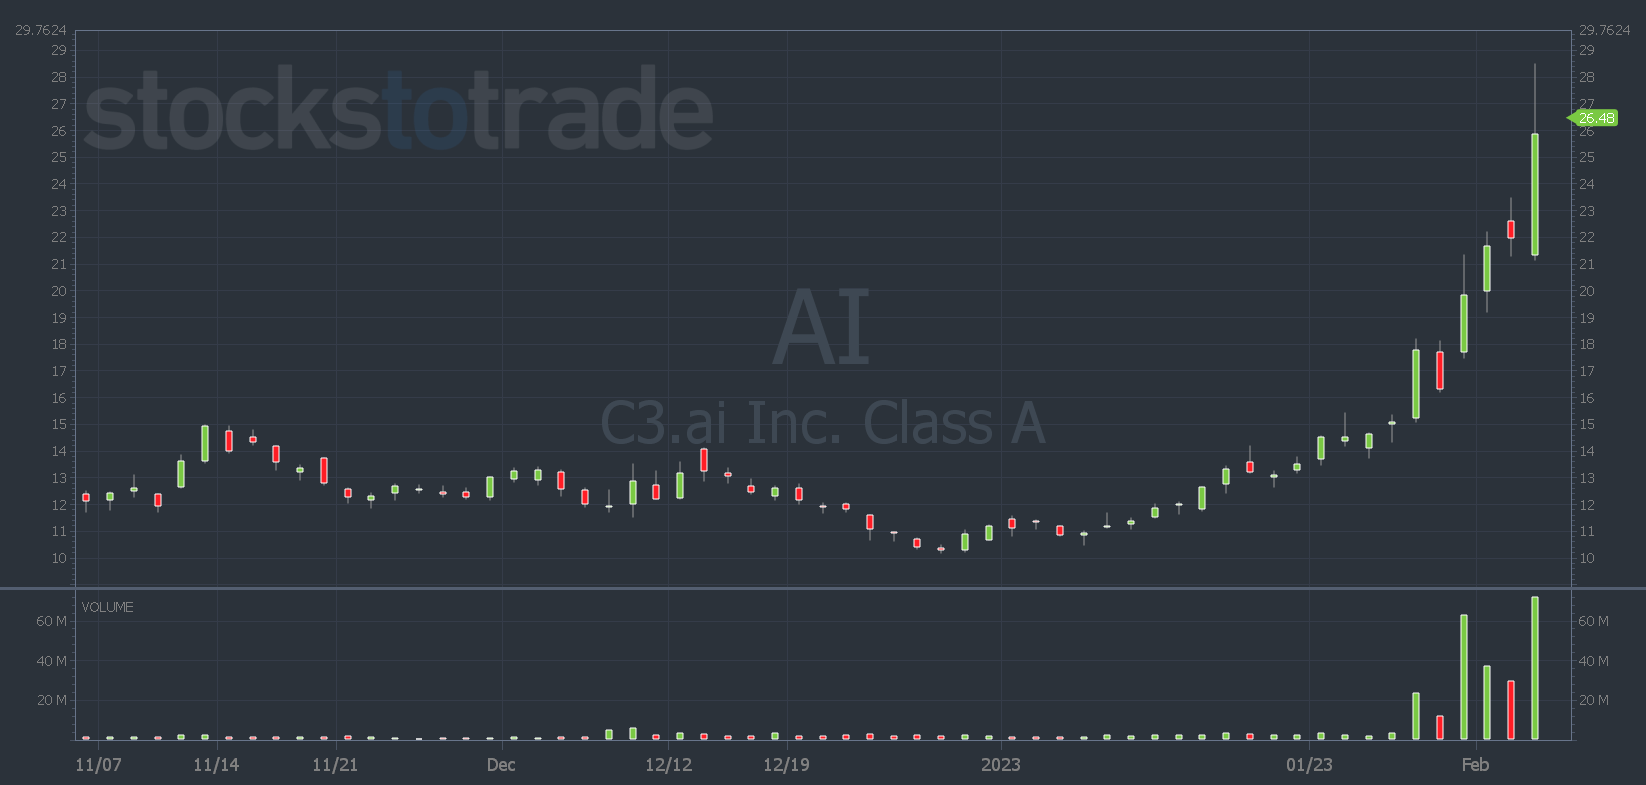
AI chart: 3-month, daily candle — courtesy of StocksToTrade.com
The stock is trading high volume and breaking through resistance levels. It’s making higher lows and higher highs.
A downtrend looks like this…
There’s no volume. The stock sinks day after day and the chart is full of red candles meaning it’s making lower lows.
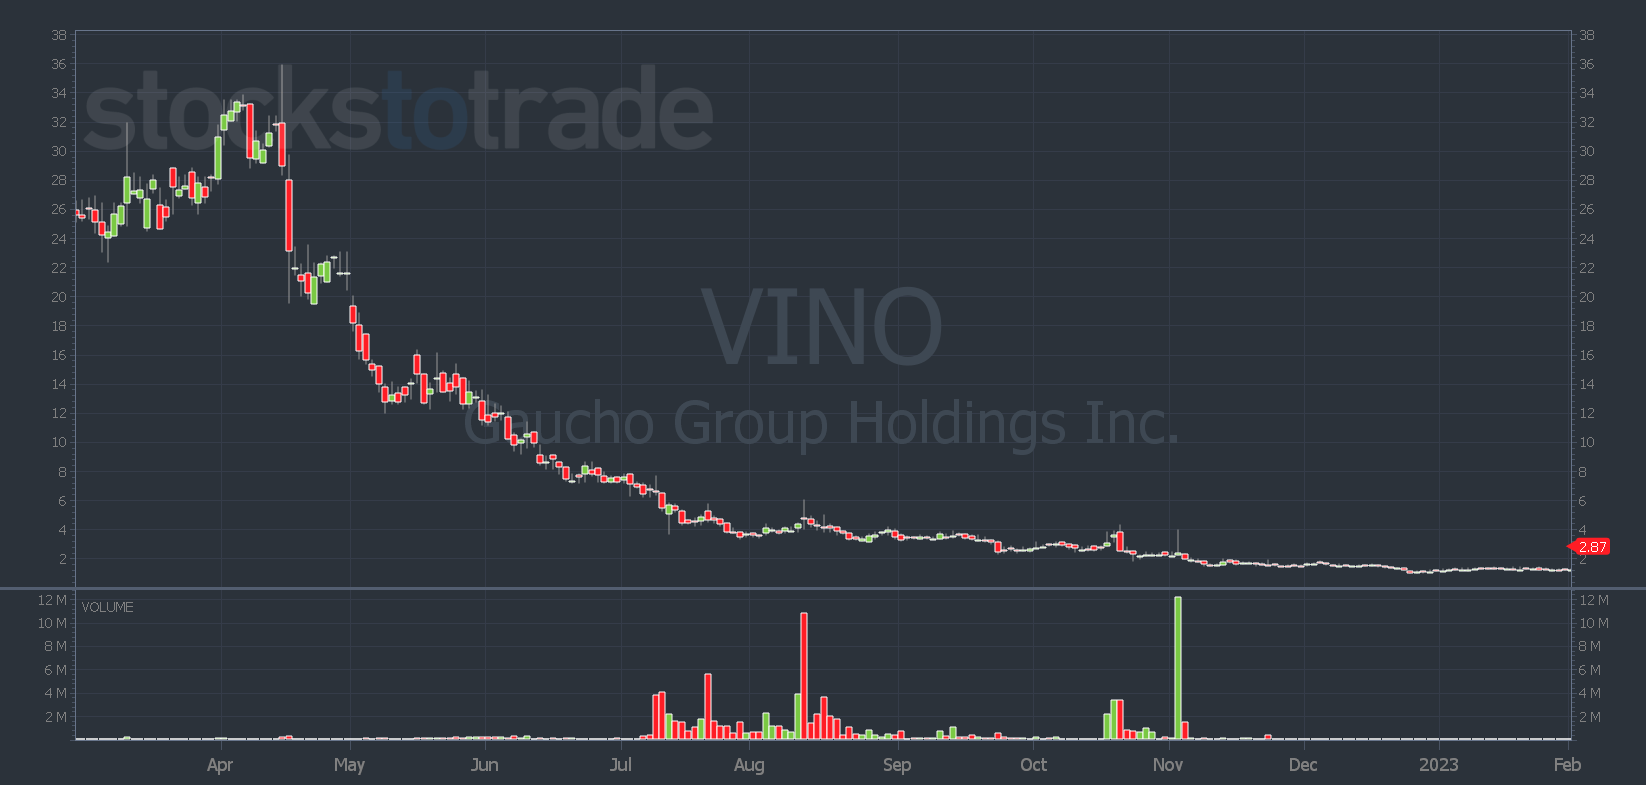
VINO chart: 1-year, daily candle — courtesy of StocksToTrade.com
Joining a trend is important because it helps you capture potentially big moves in the direction you’re looking for.
But trading trends also help you avoid the dreaded choppy chart…
Where a stock is just going sideways along VWAP … Maybe having fake breakouts or breakdowns that make you enter a position only to get stopped out for a loss.
Below is a two-day chart of Genius Group Limited (AMEX: GNS).
Sure, it looks like there are opportunities to catch upside or downside moves…
But where are your odds? These are random moves … The stock is trading sideways in a channel between roughly $5 and $5.75.
There’s not a lot of potential to grow your account trading a stock that moves like this…
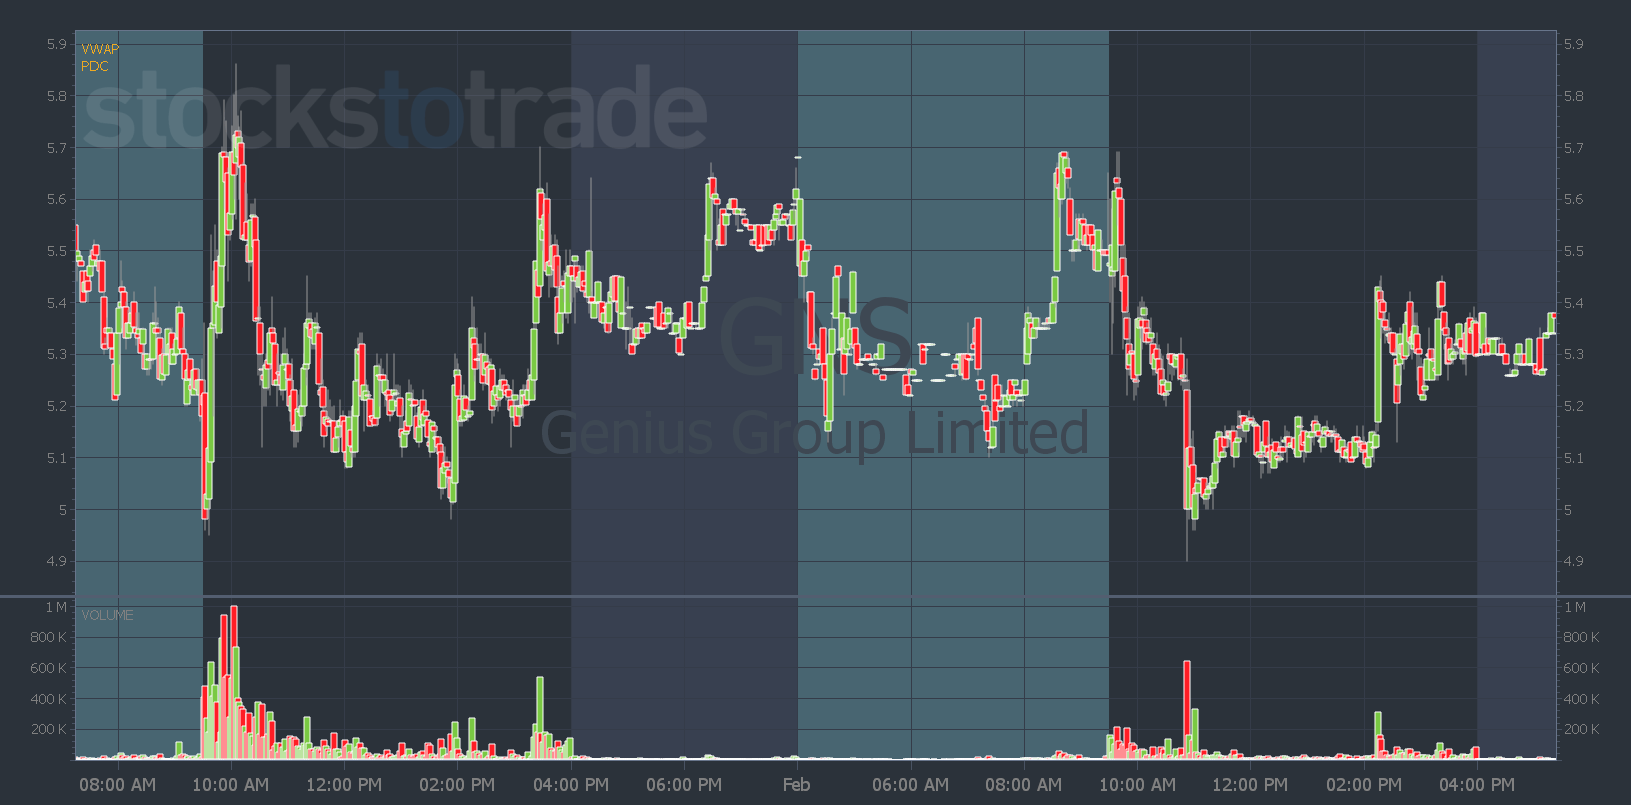
GNS chart: 2-day, 2-minute candle — courtesy of StocksToTrade.com
As a day trader, swing trader, or momentum trader, you want to avoid those charts that only result in a bunch of papercut losses, a mountain of frustration, and wasted day trades.
Instead, you want to look for a stock in a trend and try to join it. Before you take a trade, think of the famous quote, “the trend is your friend.”
Here’s how to spot them…
5 Ways to Spot Trends
I think going long is better for new traders, so I’m going to focus on how to spot uptrending charts.
To find stocks in an uptrend I like to see…
- Higher highs and higher lows on the chart.
- A stock in a hot sector.
- Trading high volume.
- Breaks through resistance.
- Above VWAP.
Price action and VWAP are the most important indicators to me. But the more indicators, moving averages, and resistance levels the stock is above — the better.
How You Can Trade Trends
I don’t like to play guessing games or try to anticipate upside moves. I look for a stock that meets my criteria for an up-trending stock. Then I wait for confirmation that the stock could continue higher…
And that means looking for entries around breaks above resistance levels.
Either multi-day or multi-month breakouts on the daily chart. Or high-of-day breaks on the intraday chart.
Here’s an example in recent runner, BigBear.ai Holdings, Inc. (NYSE: BBAI)…
On the intraday chart, there were plenty of opportunities to join upward trends when the stock broke its intraday highs … Which all correspondence with Oracle levels — see how you can get this powerful algo working for you here.
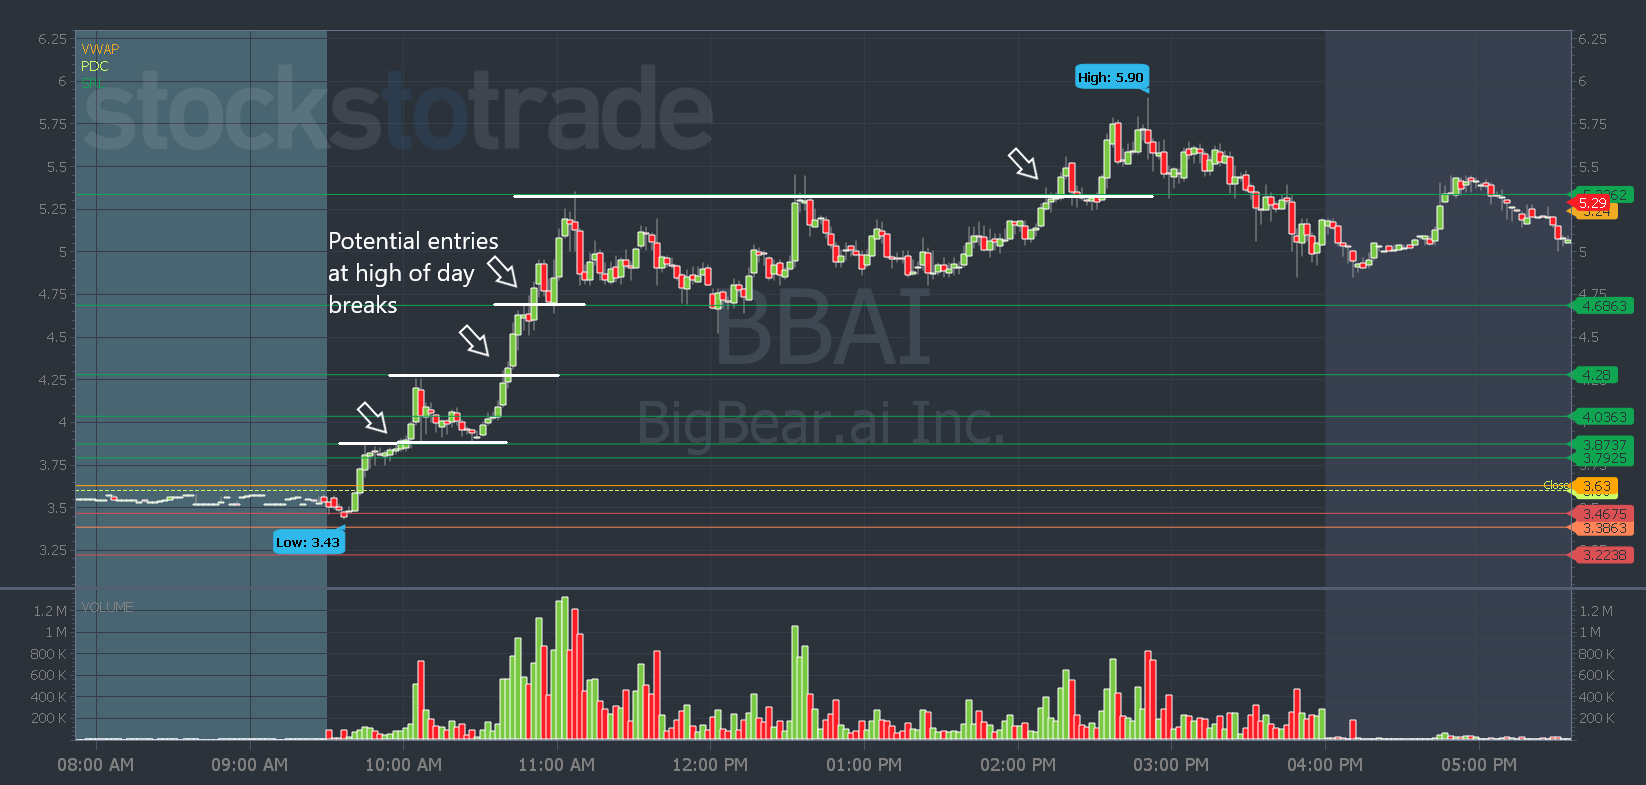
BBAI chart: 1-day, 2-minute candle — courtesy of StocksToTrade.com
But on the daily chart, there was another way you could’ve joined this upward trend…
The stock checked the criteria for an upward trend…
It was making higher highs and higher lows before it consolidated for a few days. It traded high volume and it’s in a hot sector.
It broke through resistance and was trading above VWAP on the intraday chart.
You could’ve bought the multi-day breakout over any of the last few days’ highs. Again, Oracle laid out multiple levels you could have used as entry points.
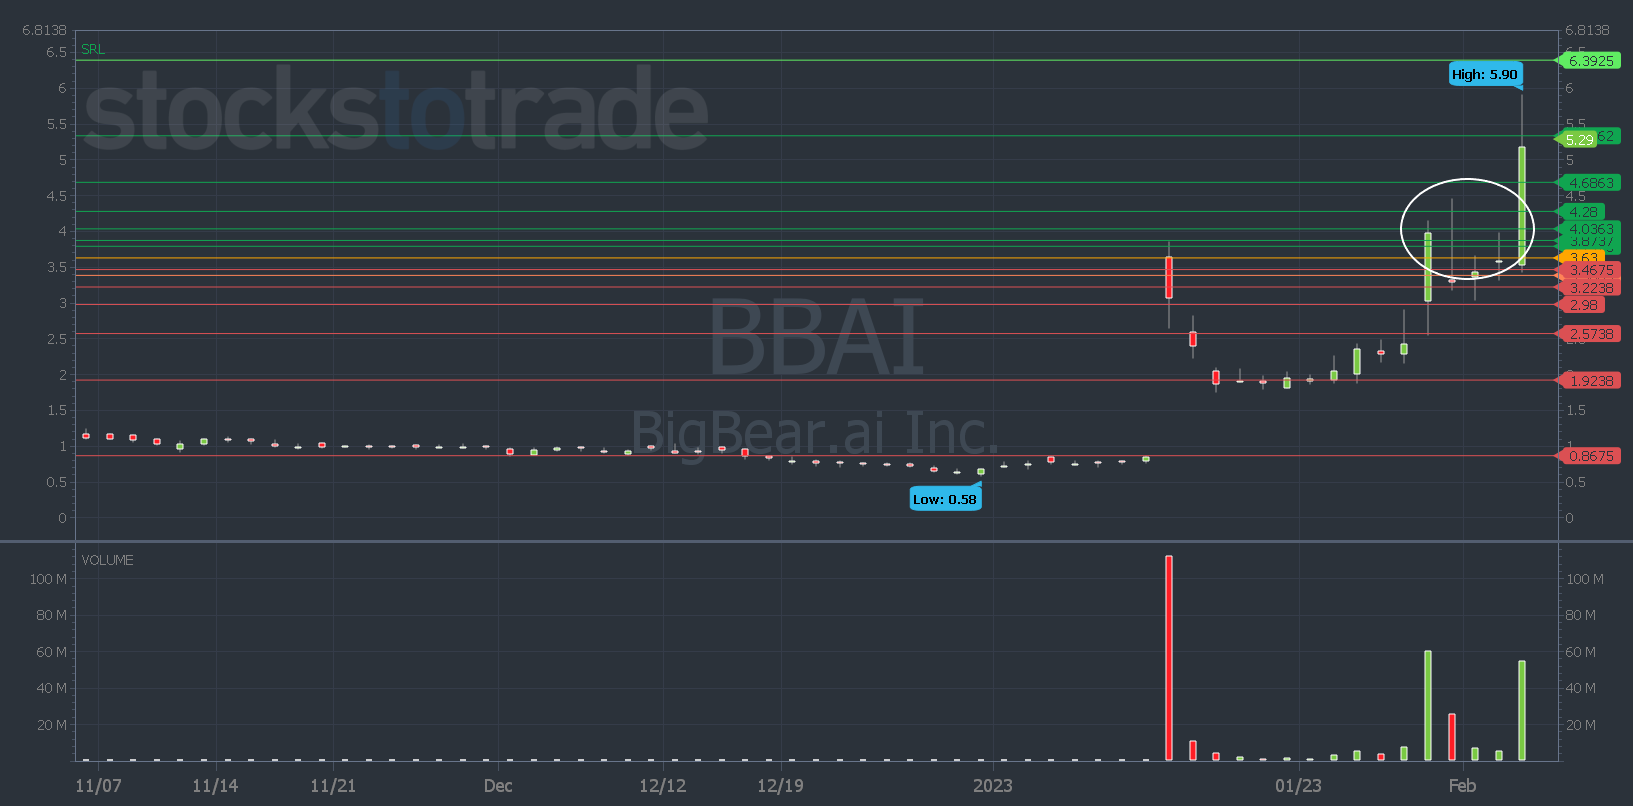
BBAI chart: 3-month, daily candle — courtesy of StocksToTrade.com
Then you can use the Oracle levels to also guide you out of the trade.
You can take profits at the next resistance area. Or you can take some off and let the rest ride and see if it can retest the next level without breaking below support.
Waiting for confirmation and for the stock to prove itself is how you can join trends and cut out time-wasting and money-losing trades.
Get all the stocks and plays I’m focused on with my market updates videos, three times a week!
Join me here and I’ll see you there.
Have a great day everyone.
Tim Bohen
Lead Trainer, StocksToTrade