The cryptocurrency markets are awash with one thing that short-term traders covet–high volatility.
Many crypto coins are quite capable of making 10-20% intraday moves, which is rare in the forex, stocks, bonds and commodities markets.
The unique characteristics of the crypto markets make technical charts invaluable tools to help the trader predict the direction, momentum and support/resistance levels for cryptos such as bitcoin and ethereum.
Before diving into the charts, first a caveat: crypto markets are still relatively young, and only coins with high volumes tend to lend themselves well to technical analysis. For example, when looking at support/resistance levels, only bitcoin currently has well-defined levels while the other coins are still trying to find their footing. Generally speaking, support and resistance levels get less reliable as you go down the crypto hierarchy in terms of volumes and market caps.
Download a PDF version of this post as PDF.
Without further ado, the brass tacks:
#1 Elliott Wave Analysis
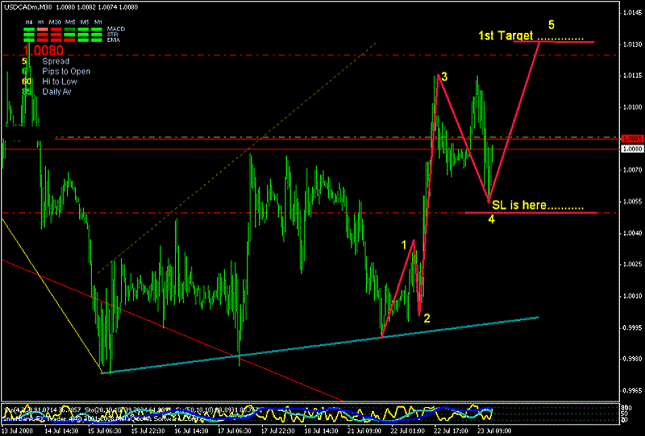
Elliott Wave is a special type of technical analysis that traders use to analyze and forecast market cycles and trends by identifying extreme price highs/lows, investor psychology and other such factors.
The Elliott Wave Principle works on the premises that markets are influenced by collective investor psychology aka crowd psychology, which makes it move in natural sequences of optimism and pessimism.
Elliott Wave lends itself well to cryptocurrency & Altcoin trading because there are no true fundamentals that are currently driving the crypto markets; rather investor sentiment is the main driver of prices.
Traders who use Elliott Wave believe that the price action is mainly divided into groups of five waves. Using this technique boils down to simply a matter of getting the wave count right:
#2 Fibonacci Levels
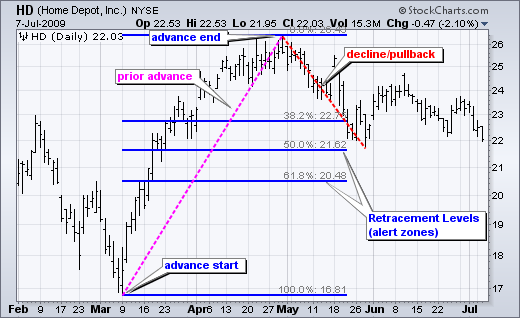
Fibonacci Levels is a popular tool that is based on the Fibonacci Sequence. It’s used to predict support/resistance levels for different types of assets.
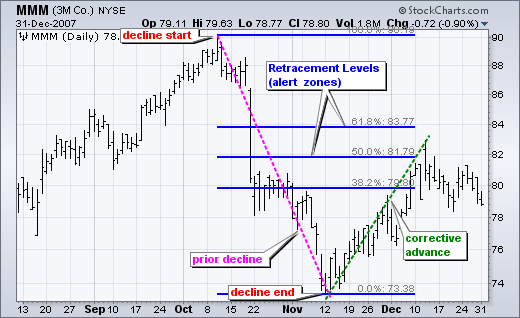
The most commonly used Fibonnacci levels are 38.2% and 61.8%, often rounded off to 38% and 62%.
Fibonacci levels alert the trader to a possible trend reversal, support or resistance level. A bounce in a trend is usually expected to retrace at least part of the previous trend. Traders can use Fibonacci Retracement levels to identify possible bullish reversals during downtrends or possible bearish reversals during uptrends.
Trend reversals do not always happen at Fibonacci levels. Traders should therefore confirm a reversal using other tools such as candlestick patterns, price patterns, moving averages and momentum oscillators.
#3 MACD or Moving Average Convergence/Divergence
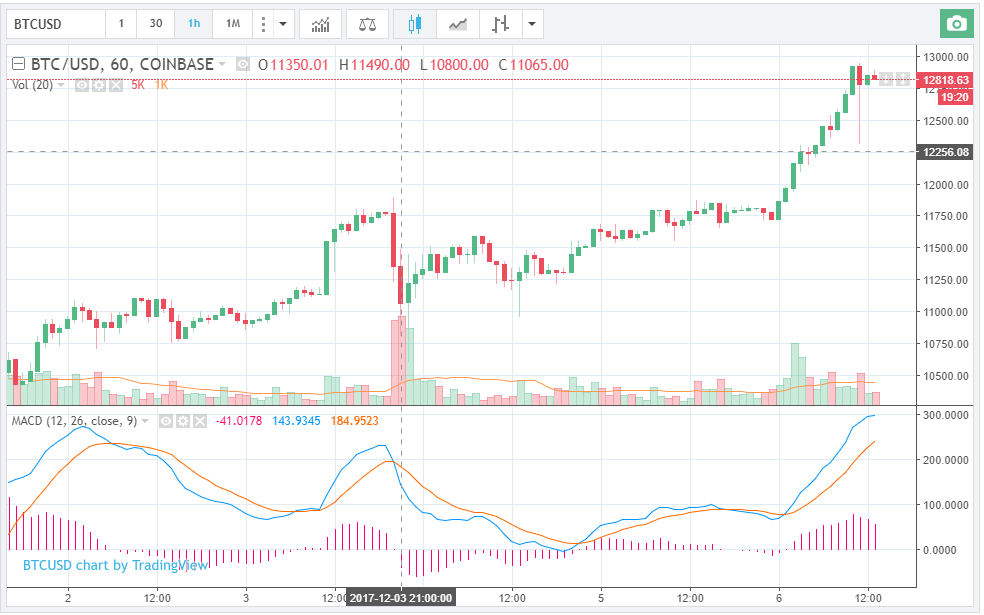
MACD or Moving Average Convergence/Divergence is a highly popular indicator with day traders. MACD is used to compare price movements between a short-term moving average and a long-term moving average. The 12-day exponential moving average (EMA) and the 26-Day EMA are typically used. MACD can be used as a trend-following indicator and also as a momentum indicator.
MACD is effective for daily, weekly, or monthly charts. MACD divergences should, however, be used with caution because bearish divergences are possible during strong uptrends while bullish divergences can also happen in a strong downtrend.
#4 Stochastics and Relative Strength Index (RSI)
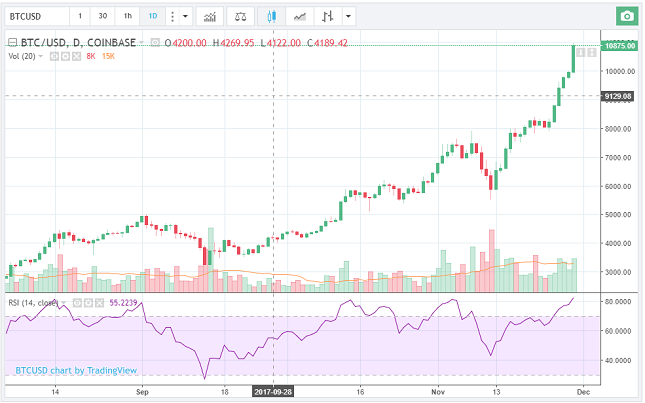
Stochastics and Relative Strength Index (RSI) belong to a group of technical analysis tools known as oscillators because they move between 0-100. They are both used to determine the strength of a trend as well as predict tops and bottoms based on overbought or oversold conditions. An RSI reading of 70 and above signals an overbought condition while 30 and below signals an oversold condition.
Bitcoin frequently trades in overbought or oversold conditions due to its high volatility.
A trader can use RSI to enter or exit various positions. A prolonged move will take the RSI reading close to 100, indicating an overbought condition and an approaching correction. A long downward move will take the RSI close to zero indicating an oversold condition and an approaching correction.
RSI is effective at identifying overbought and oversold conditions in a ranging markets, but can give false signals in strongly trending markets (either bullish or bearish).
#5 Ichimoku Clouds
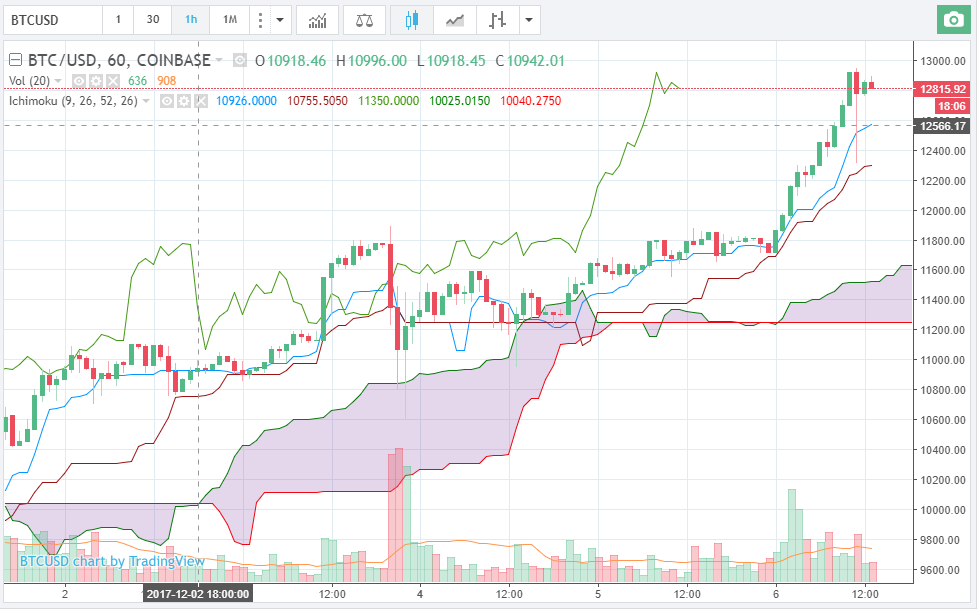
Ichhimoku clouds are used to define support and resistance areas, identify trends and their momentums and also provide trading signals.
The clouds are formed by plotting moving averages six months ahead and 52-week highs and lows plotted six months ahead as well. The cloud spans between the forward moving average and the mid-point of the forward 52-week high and low.
The trend is interpreted to be bullish when prices are above the cloud, bearish when they are below the cloud and flat when they are within the cloud.
Useful Trading Setups
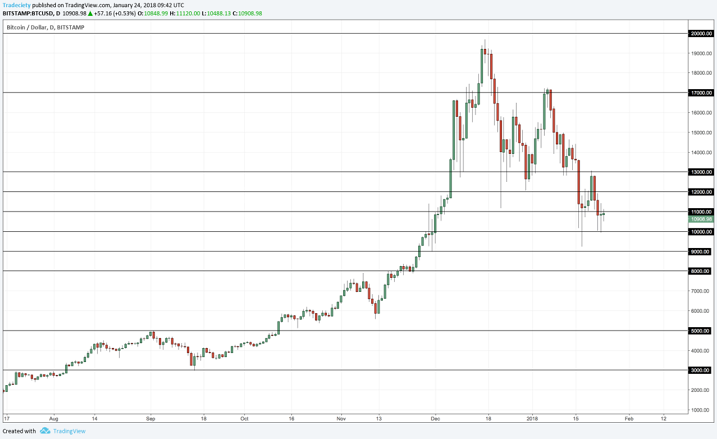
Round numbers
Round numbers have been having an important psychological effect in the bitcoin market. This could be due the fact that the media tends to hype up things whenever bitcoin prices approach a huge round number such as 10k, 20k, and so on.
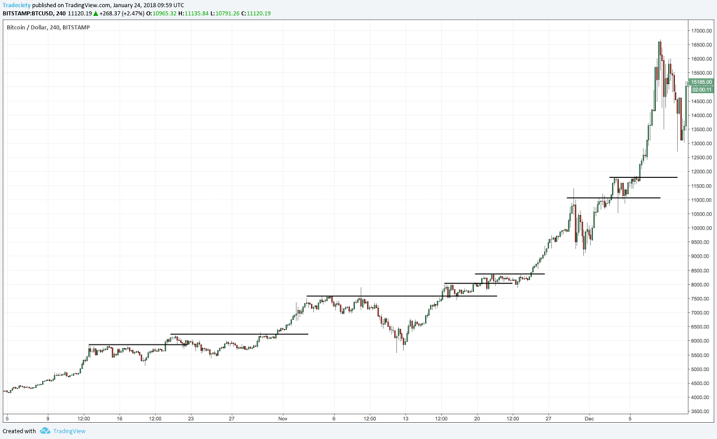
Breakouts
Horizontal breakouts seemed to work very well in the bitcoin market before it topped out at around $20k. Since then, they have not been very reliable. They, however, could still work for other coins that are still in bullish mode.
Always remember that technical analysis is just one of the ingredients that go into successful trading in the crypto markets. The trader also needs to be diligent and disciplined, including using stop losses.
It’s also important to identify 2 or 3 setups that are reliable at any one given time and stick to them. Further, avoid using too many indicators since this can be confusing.
New to cryptocurrency? Learn more about it here.
Also See: The Evolution of Cryptocurrency Mining

