
Don’t let your hard work and due diligence get you into trouble. If that sounds contradictory, remember this…
You need a trade thesis and an overall approach to the market. Way too many traders pile in without a plan. But once you’ve developed a thesis, it can lead to a whole new risk. Which is why there’s one crucial fallback for guidance…
Weird 100-Year-Old Pattern Where the Chart Creates the Plan For You

Table of Contents
The Big Picture
We always use the chart to guide us. If you let your bias get in the way of what the chart is telling you, it only leads to pain.
Last week’s S&P 500 is a good example. We pulled back hard on Thursday (Nov. 5). But remember, we were at all-time highs a month earlier. The reality is, the market has to sell off at some point.
So, the election happened and technology stocks sold off. But if you look at the post-election sell-off, we only fell back to that area of consolidation established over the summer.
Here’s the SPDR S&P 500 ETF Trust (NYSE: SPY) chart to lay out my thought process:
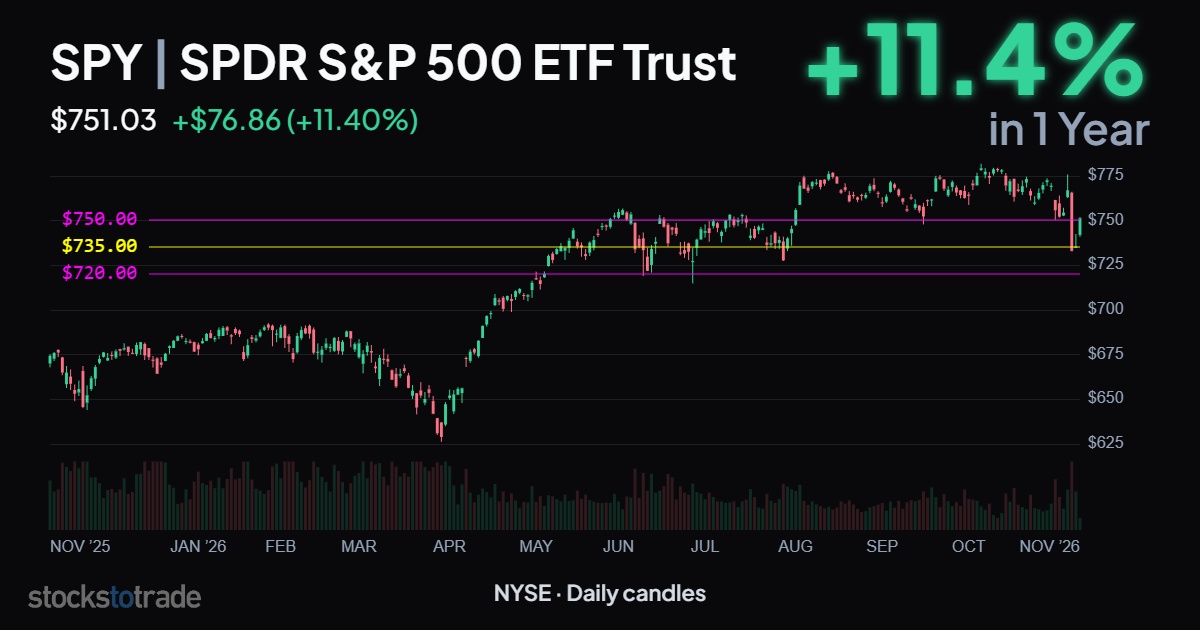
SPY 1-year, daily candles, consolidation zone
As you can see, the summer consolidation zone was between $720 and $750.
For me, that’s the area of significance. It’s also right where we settled into at the end of last week and into yesterday.
So, which way is it going? This is why we study charts so much…
The Chart Is the Ultimate Arbiter of Truth
At the end of the day, we have consolidation and support right in the range where the S&P 500 is trading.
Now, if these levels start giving way, it’s gonna get ugly. If that happens, I would say forget the AI trade and the tech trade for 6+ months.
Chip stocks, AI stocks, and even a lot of software stocks won’t be the hot sector for a while. Money will pivot somewhere else.
That said, if the market maintains these levels, if we can break that range to the upside, then I’m bullish on the AI trade and the overall market.
Just remember, no matter the thesis or bias, the chart always wins.
I think a lot of new traders get into trouble with this. It’s important to have a trade thesis and a trade plan, as long as you remember…
The Chart Overrides Research
It’s important to do your due diligence. But don’t let the fact that you’ve put a lot of time into researching a stock keep you from believing what the chart is telling you.
Regardless of all the due diligence, working effort, and research that you do, if the chart breaks, it all goes out the window.
My Take
I’d rather be wrong in a cash position than wrong in a big loser. You have to respect the chart. We can have our trade thesis. We can have the overall way we approach the market. But no matter our thesis, bias, style, or strategy…
The chart always wins.
Watchlist
After Nvidia (NASDAQ: NVDA) CEO Jenson Huang admitted over the weekend to having an affair with an alleged Chinese spy, the stock dropped 6%. That put the inverse ETFs into play.
GraniteShares 2x Short NVDA Daily ETF (NASDAQ: NVD) gapped up, tapped the signal, pulled back, and then consolidated.
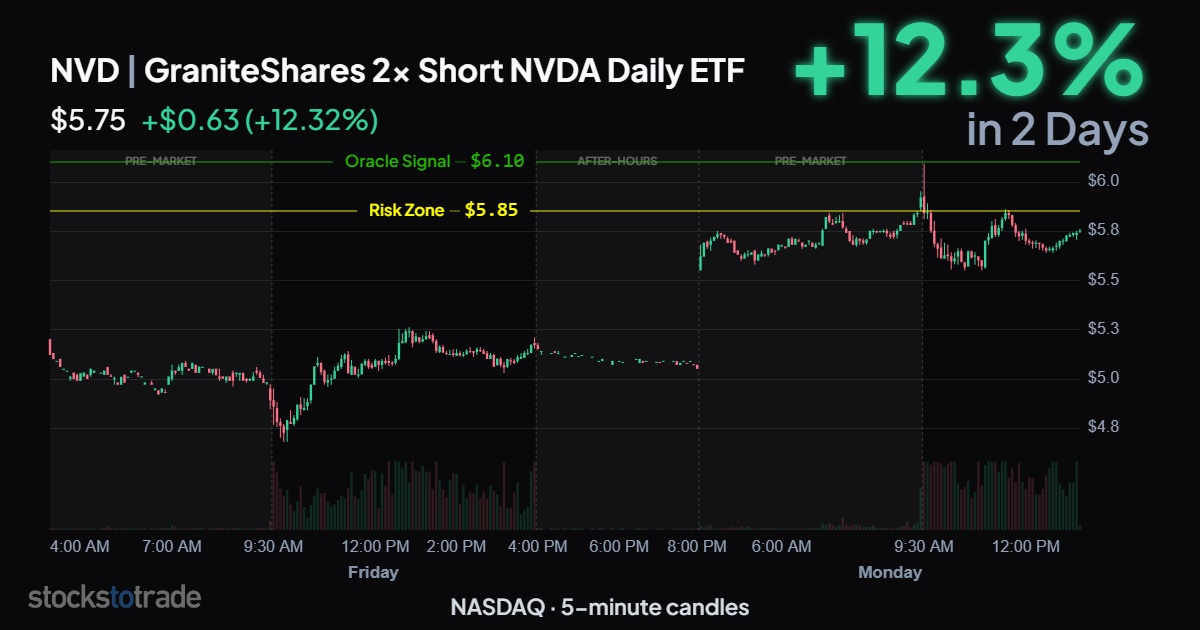
NVD 2-day, 5-min candles
Look for breaks of the Oracle signal at $6.10, with risk around $5.85. Target mid-to-high $6s. Keep in mind that leveraged daily ETFs reset at the end of every trading day.
On My Radar
- CPI here at 8:30 a.m. ET today (Nov. 10)
- How the Nvidia (NASDAQ: NVDA) “spy-gate” story affects the AI trade
- Earnings on deck: CoreWeave Inc. (NASDAQ: CRWV) reports today after the bell
- Watch below and click here if you want next week’s Money Mondays alert
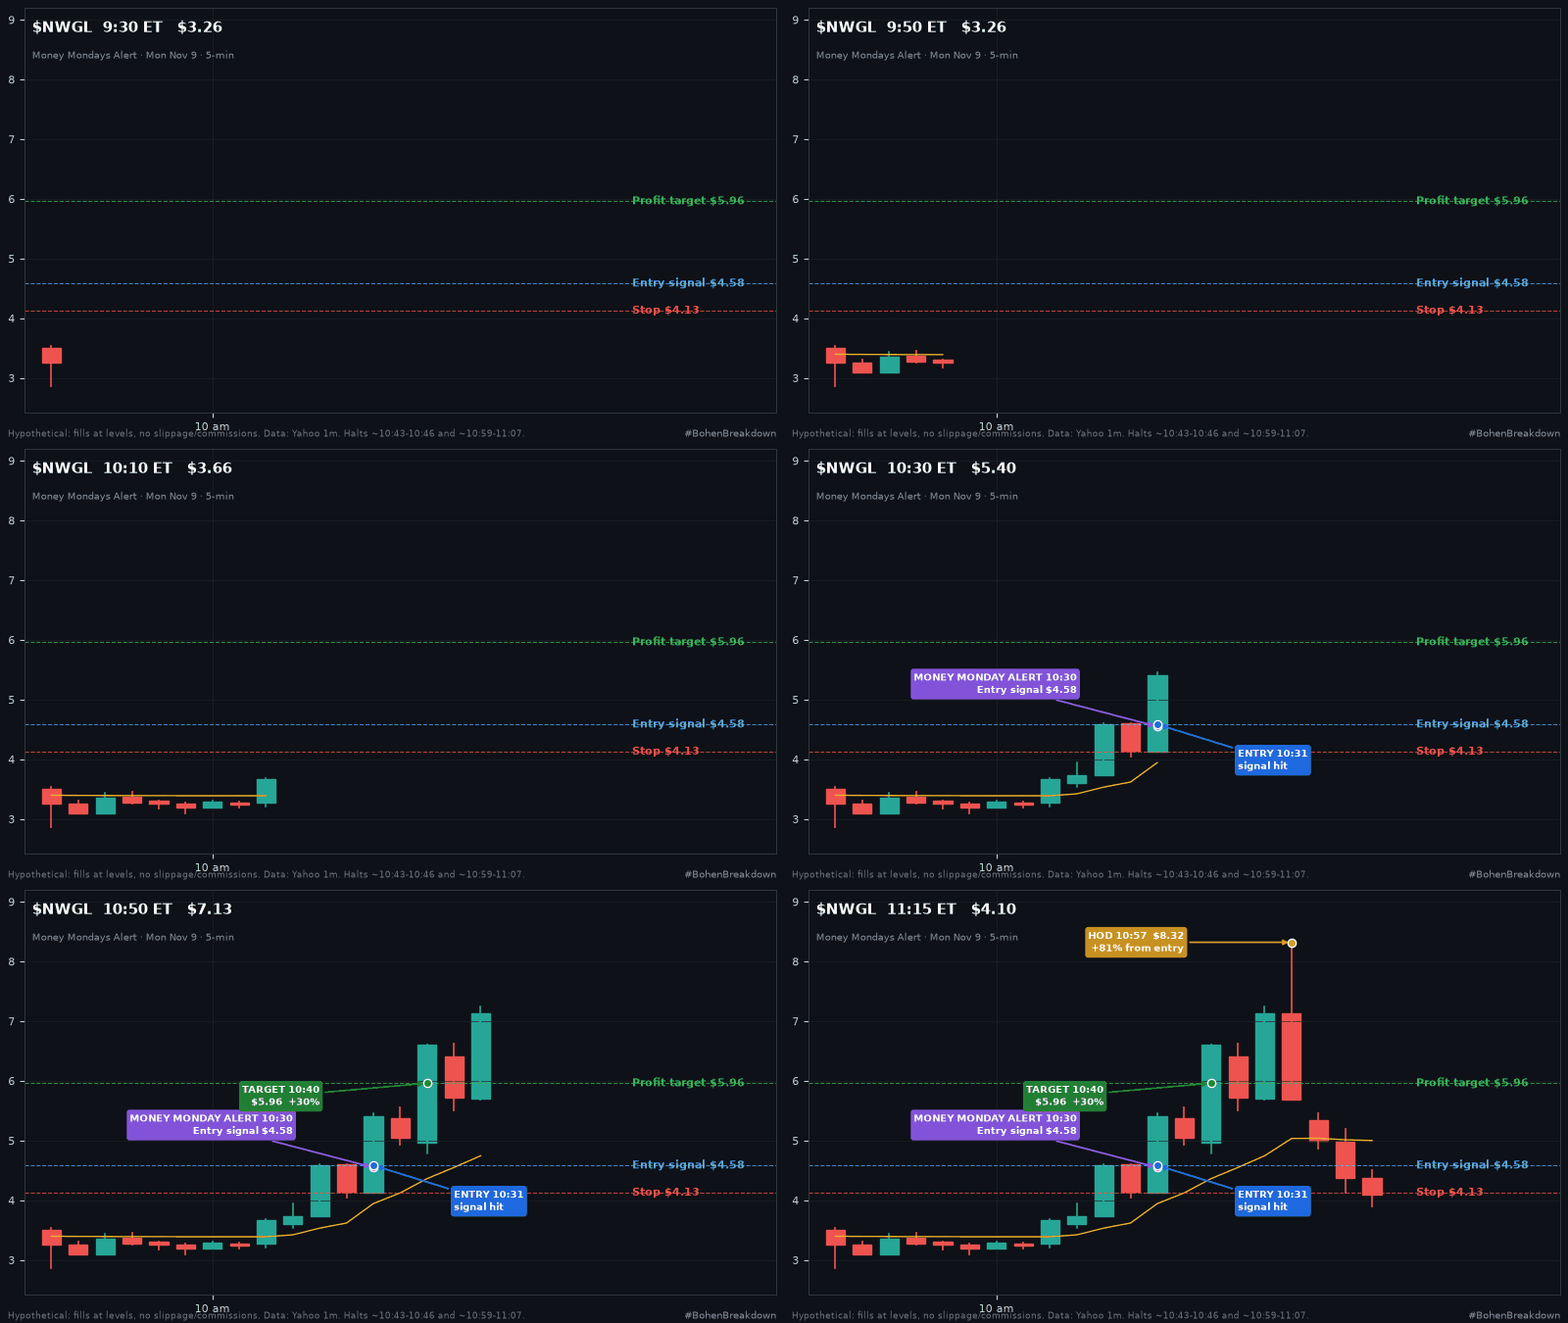
NWGL 11/9/26 Money Monday alert*
*Past performance is not indicative of future results.