
Over the last few weeks, we’ve seen stocks like Ambrx Biopharma Inc. (NYSE: AMAM) gain 102%, Unicycive Therapeutics, Inc. (NASDAQ: UNCY) climb 277%, and Cardio Diagnostics Holdings, Inc. (NASDAQ: CDIO) soar 533%!
What did all these huge gainers have in common?
They’re all short squeezes.
And they’re great moves for day traders because you can catch huge upside moves that usually happen quickly.
But to catch these moves, you have to be able to recognize when a stock is potentially loaded with short sellers…
And to do that, you have to understand how they think…
What moves are they looking for to enter a short position? And what moves on the chart can indicate they’re wrong and in a losing position?
That’s what I’m going to show you today…
Here are three signs that can indicate a stock has the potential to squeeze — before it does.
Table of Contents
3 Ways You Can Spot A Potential Squeeze
Before a stock can squeeze shorts to the upside, it has to lure short sellers in.
So you have to get into the short sellers’ minds and understand whether a stock is full of shorts before you can determine if it has the potential to squeeze.
And before you can take advantage of the moves on the long side — you have to understand the short side of the trade.
As long traders we look for stocks to break above key levels before we take an entry to potentially ride more upside momentum. Or we look for dips to support where the stock can potentially bounce. Short sellers do the opposite…
They look to enter breaks below support believing the stock is shifting momentum to the downside. Or they short spikes into resistance.
For a stock to have the most potential to squeeze shorts is when short sellers get trapped in a losing position…
What we want to look for is where a stock makes a move that makes short sellers think it’s breaking down, so they pile into positions.
But then it reverses and continues to the upside.
This is called a short trap. Here are three examples of what they can look like…
A Dip Below VWAP
Day traders use VWAP as an indicator of bullish or bearish price action. If a stock is trading above VWAP it’s often considered bullish. And if it’s trading below VWAP it can be bearish.
So when a stock dips below VWAP, shorts can look at that as a momentum shift to the downside. And they can start taking positions expecting the stock to continue lower.
But if the stock holds up, reclaims above VWAP, and goes higher — all the shorts that shorted below VWAP are in a losing position. That adds more buyers to the squeeze when shorts have to buy to cover.
Look at this chart of Bellerophon Therapeutics, Inc. (NASDAQ: BLPH) yesterday…
The stock dipped below VWAP in the morning, sucking in even more shorts from the previous day when the stock broke down from its highs…
And when the stock broke back above VWAP it continued higher, squeezing shorts.
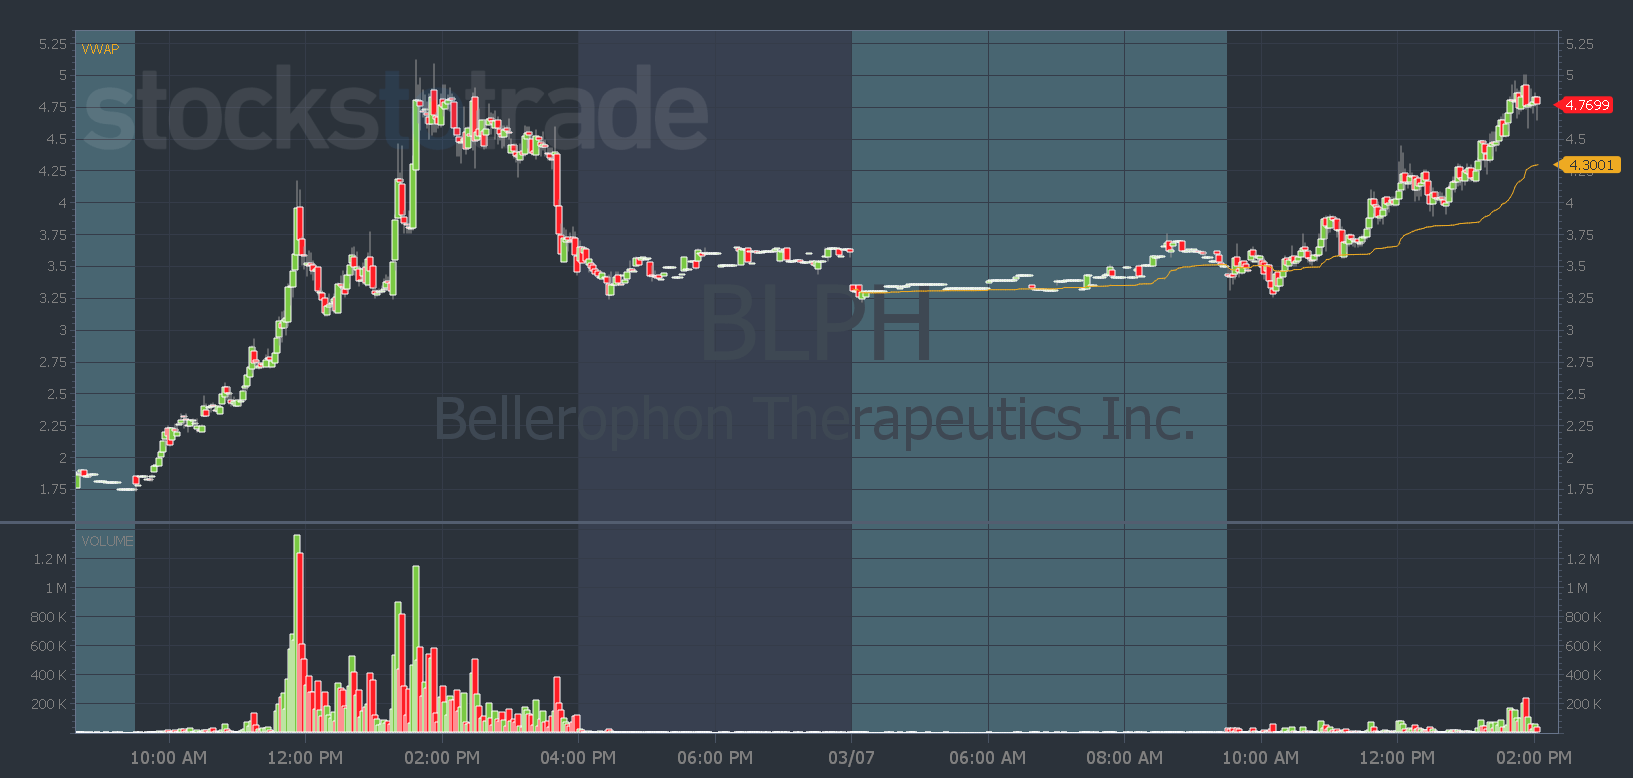
BLPH chart: 2-day, 2-minute candle — courtesy of StocksToTrade.com
Break Below Support
A break below a support level can work the same as a break below VWAP — short sellers think it means a shift in momentum to the downside…
But if the stock dips below support and bounces quickly, that can trap shorts who entered on the breakdown below support.
Watch this video to see Bryce Tuohey explain what a short trap is and what he saw on the AMTD Digital Inc. (NYSE: HKD) chart before it squeezed to $2,500 in August 2022.
A Big Red Candle
A big red candle to the downside can indicate a lot of selling pressure. But it can also be created because a stock dips and takes out stop losses.
We typically see a big red candle suck in short sellers when it occurs near the top of a spike near resistance.
Short sellers can enter when they see selling pressure and use the high of the recent spike as their risk.
But when the stock breaks above that resistance level, it can create a lot of buy orders as stuck shorts try to exit…
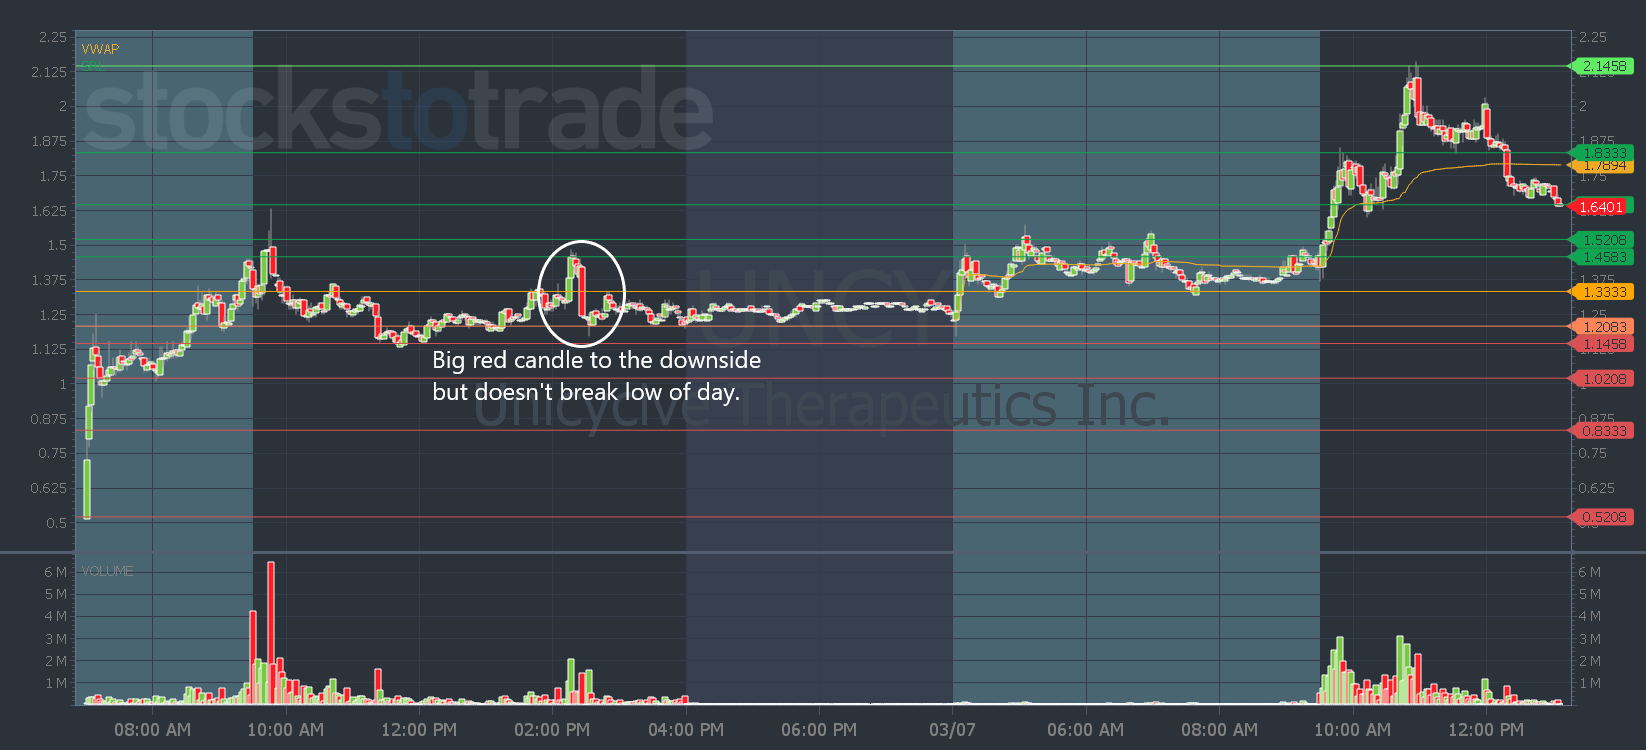
UNCY chart: 2-day, 2-minute candle — courtesy of StocksToTrade.com
You can see that Unicycive Therapeutics, Inc. (NASDAQ: UNCY) had a big red candle when it spiked into resistance on Monday afternoon.
And when it broke above that level yesterday morning, it created a short squeeze because all the short sellers from the day before were down on their positions.
Now that you know what can cause some of my favorite moves in the market — find out what I’m watching and what I see working in the market in my weekly Market Update videos. I send them three times a week.
And when you join StocksToTrade Advisory, you also get a detailed monthly report, an exclusive weekly watchlist, and my ebook.
Have a great day everyone. See you back here tomorrow.
Tim Bohen
Lead Trainer, StocksToTrade