The stock markets have become an indomitable buying frenzy of the current decade, thanks mainly to the Fed’s near-zero rate interest policy. The 8-year bull market has seen the broad-market S&P 500 Index triple while the Nasdaq Composite and the Dow Jones have more than doubled.
S&P 500 10-Year Daily Chart
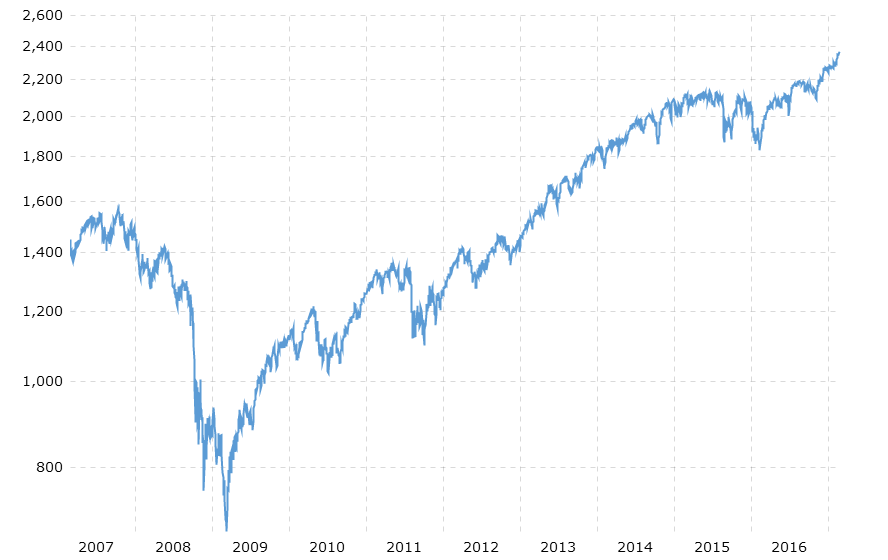 Source: Macrotrends
StocksToTrade—now better than ever! We ushered in the New Year with some major advancements that include 3 unique features, exclusive to our Platform.
Market liquidity in danger zone
But cracks have now begun to appear in several places. Some key metrics suggest that the markets have overheated and could be ripe for a correction, especially bearing in mind that similar conditions preceded big selloffs in the past. One of these is market liquidity. Novus Partners Inc. has been keeping tabs on liquidity since 1999, and defines it as a measure of how easily the market can absorb huge selling activity by hedge fund managers and large institutional investors.
Simply put, what would happen if large investors started bailing out of stocks at the same time? Novus poised a hypothetical situation by looking at large equity funds with $2 trillion and assuming they sold 20% of their holdings on a daily basis. The hedge fund found that the current market can only absorb 13% of total industry holdings in a single month, way below the historical average of 32%.
In short, there is very little liquidity in the markets, which could act as a big risk should negative catalysts suddenly emerge and put stocks under selling pressure.
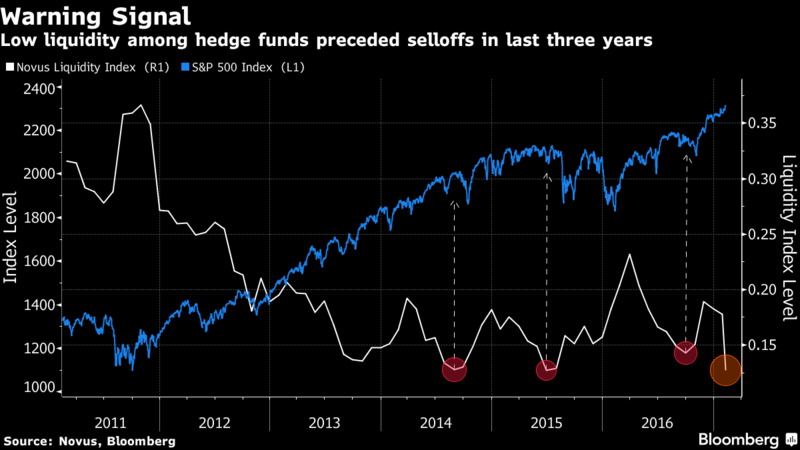 Source: Bloomberg
Low liquidity in itself is not exactly a catalyst for turbulence, but it can easily exacerbate a selloff by adding to market stress. This can become an even bigger problem due to herding–a situation where too many hedge funds crowd into favorite stocks such as Facebook (NASDAQ:FB), Microsoft (NASDAQ:MSFT), and Alphabet (NASDAQ: GOOG).
Check out STT’s new Twitter Streams! One of our most important new releases of 2017 is the inclusion of Twitter as a source of data for keeping up to date with the latest social discussions on a given stock. Every Stock tab includes a Twitter data feed which focuses only on tweets mentioning the company being tracked.
Case in point: 2016 started off on a strongly bearish note. On January 13, the S&P 500 fell about 2%. The 10 most-owned stocks by hedge funds, however, tumbled a 5.6%–nearly three times as much.
Unfortunately, herding has become an even bigger problem now, with hedge funds crowding into the same stock as never before.
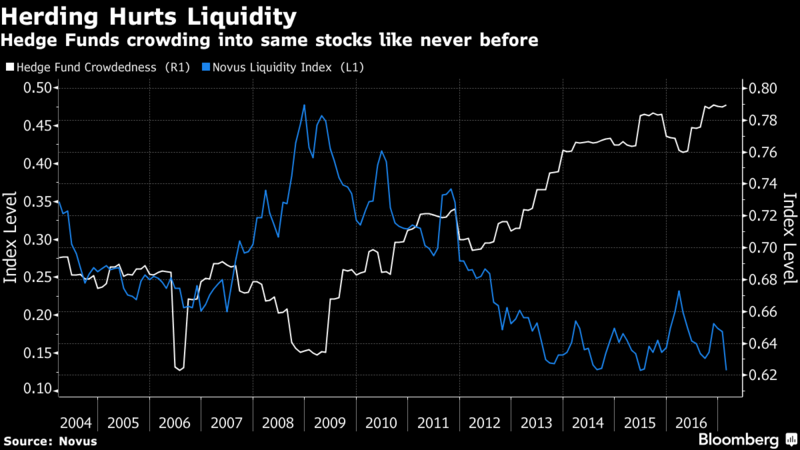 Source: Bloomberg
You can find the top 50 hedge fund holdings here.
Excessive greed in the markets
Investors are driven by two main emotions: fear and greed. Too much fear makes investors too cautious, and this can sink the stock market. Conversely, when investors become too greedy, they tend to bid up stocks to frothy valuations that are out of touch with reality. And guess what? There are clear signs of excessive greed written all over the current bull market.
CNN Money looks at seven key indicators to determine what emotions are driving the markets:
- Stock price momentum– here they compare the S&P 500 Index(SPX) against its 125-day moving average.
- Stock price strength– they consider the number of stocks hitting their 52-week highs and lows in the New York Stock Exchange.
- Stock price breadth– this is the number of stocks whose trading volume is rising versus those whose volume is falling.
- Put and call options– here they consider the put/call ratio by comparing the volume of bullish call options versus bearish put options.
- Junk bond demand– this is the spread between the yields on investment-grade bonds and junk bonds.
- Market volatility Index (VIX).
- Safe Haven Demand– here they compare the returns on stocks versus the Treasury yield.
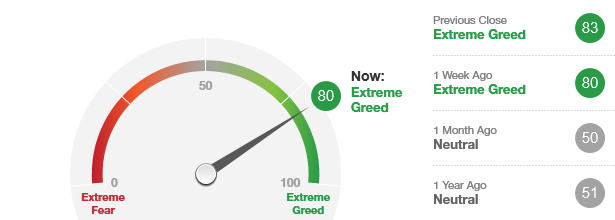
By checking how far these indicators have veered off their averages and aggregating the results, we can get a good idea of overall market sentiment. This is what is called the Fear and Greed Index.
The Fear and Greed Index is known as a reliable indicator of overall market sentiment. The current Fear and Greed Index is around 80, indicating extreme greed.
Fear and Greed Reading
Fear and Greed over Time
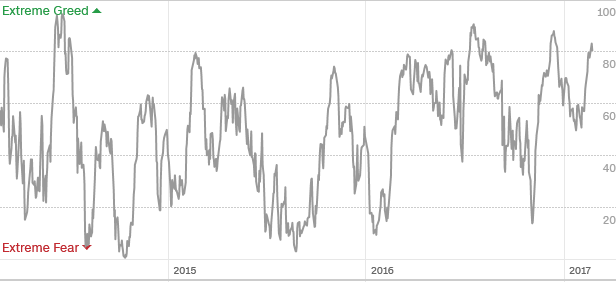 Source: CNN Money
Investors are borrowing too much money to buy stocks
Margin debt is a representation of how much money investors are borrowing to invest in the booming stock market. The latest margin data suggests that investors have been borrowing prodigiously to throw money at the bull market.
Although current debt levels are down slightly 2.2% month-over-month, they are just 3.5% off the all-time high set in April 2015.
You demanded it, and we delivered: StocksToTrade now offers Paper Trading and a new Trading Module. Our Paper Trading platform offers our customers a safe environment to practice trading without ever having to risk a cent of their capital to the market. By leveraging the real-time data provided with our service, the paper trading simulation offers an experience as close to real trading as possible. Learn more …
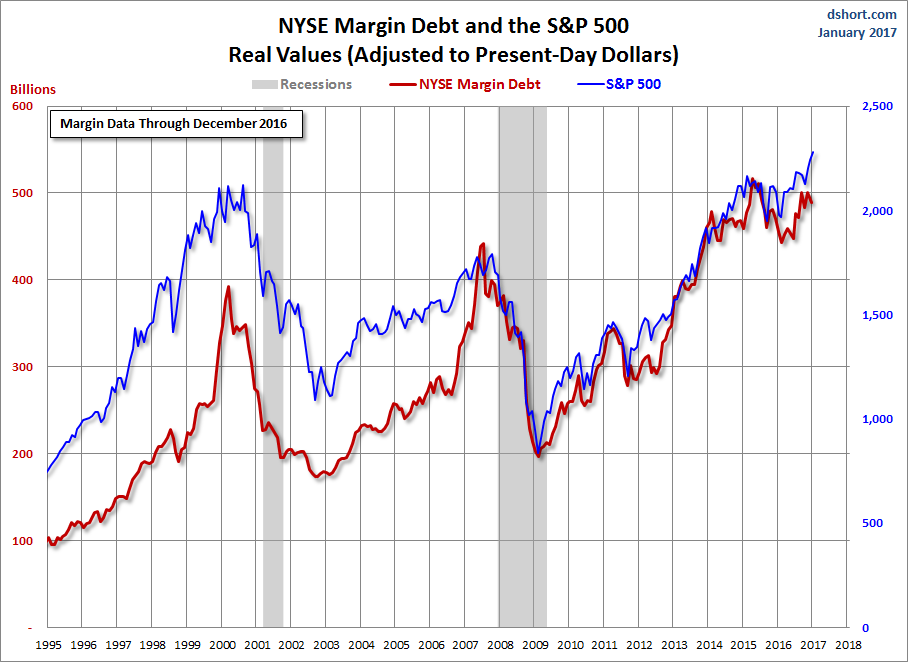 Source:Advisor Perspectives
Historical data shows that there is a high risk of a market correction when margin debt climbs too steeply. The current debt level looks eerily reminiscent of 2000 and 2008 when a similar pattern led to a market crash.
But long-term traders need to panic. The 12-month rolling average is what counts the most when it comes to the predictive power of this metric. And right now the 12-month debt margin rolling average is below the levels seen in 2000 and 2008.
Takeaway for traders
Although the metrics discussed here cannot be considered as leading indicators of equity markets, traders can benefit by keeping an eye on them. The fact that all of them point to markets that are showing clear signs of overheating raises a red flag. The Trump Trade might not be ready to toppled yet, but could start acting skittish if any missteps in execution by the administration spooks investors.