

ZenaTech Inc. plunged after regulators launched a formal probe into accounting irregularities; stocks have been trading down by -26.42 percent.
What Traders Need To Know
- Price broke down intraday from around $1.80 to near $1.40 before bouncing, showing aggressive selling followed by dip buying.
- Recent weekly candles for ZenaTech Inc. cluster near $2.00, signaling a tight trading band now under pressure.
- Deep negative profitability ratios and a high price-to-sales multiple point to a speculative profile rather than stable earnings power.
- Balance sheet shows meaningful cash and working capital, giving ZENA some runway despite ongoing losses.
- Traders should focus on whether $1.50-$1.60 can stabilize as a new short-term base after the intraday flush.
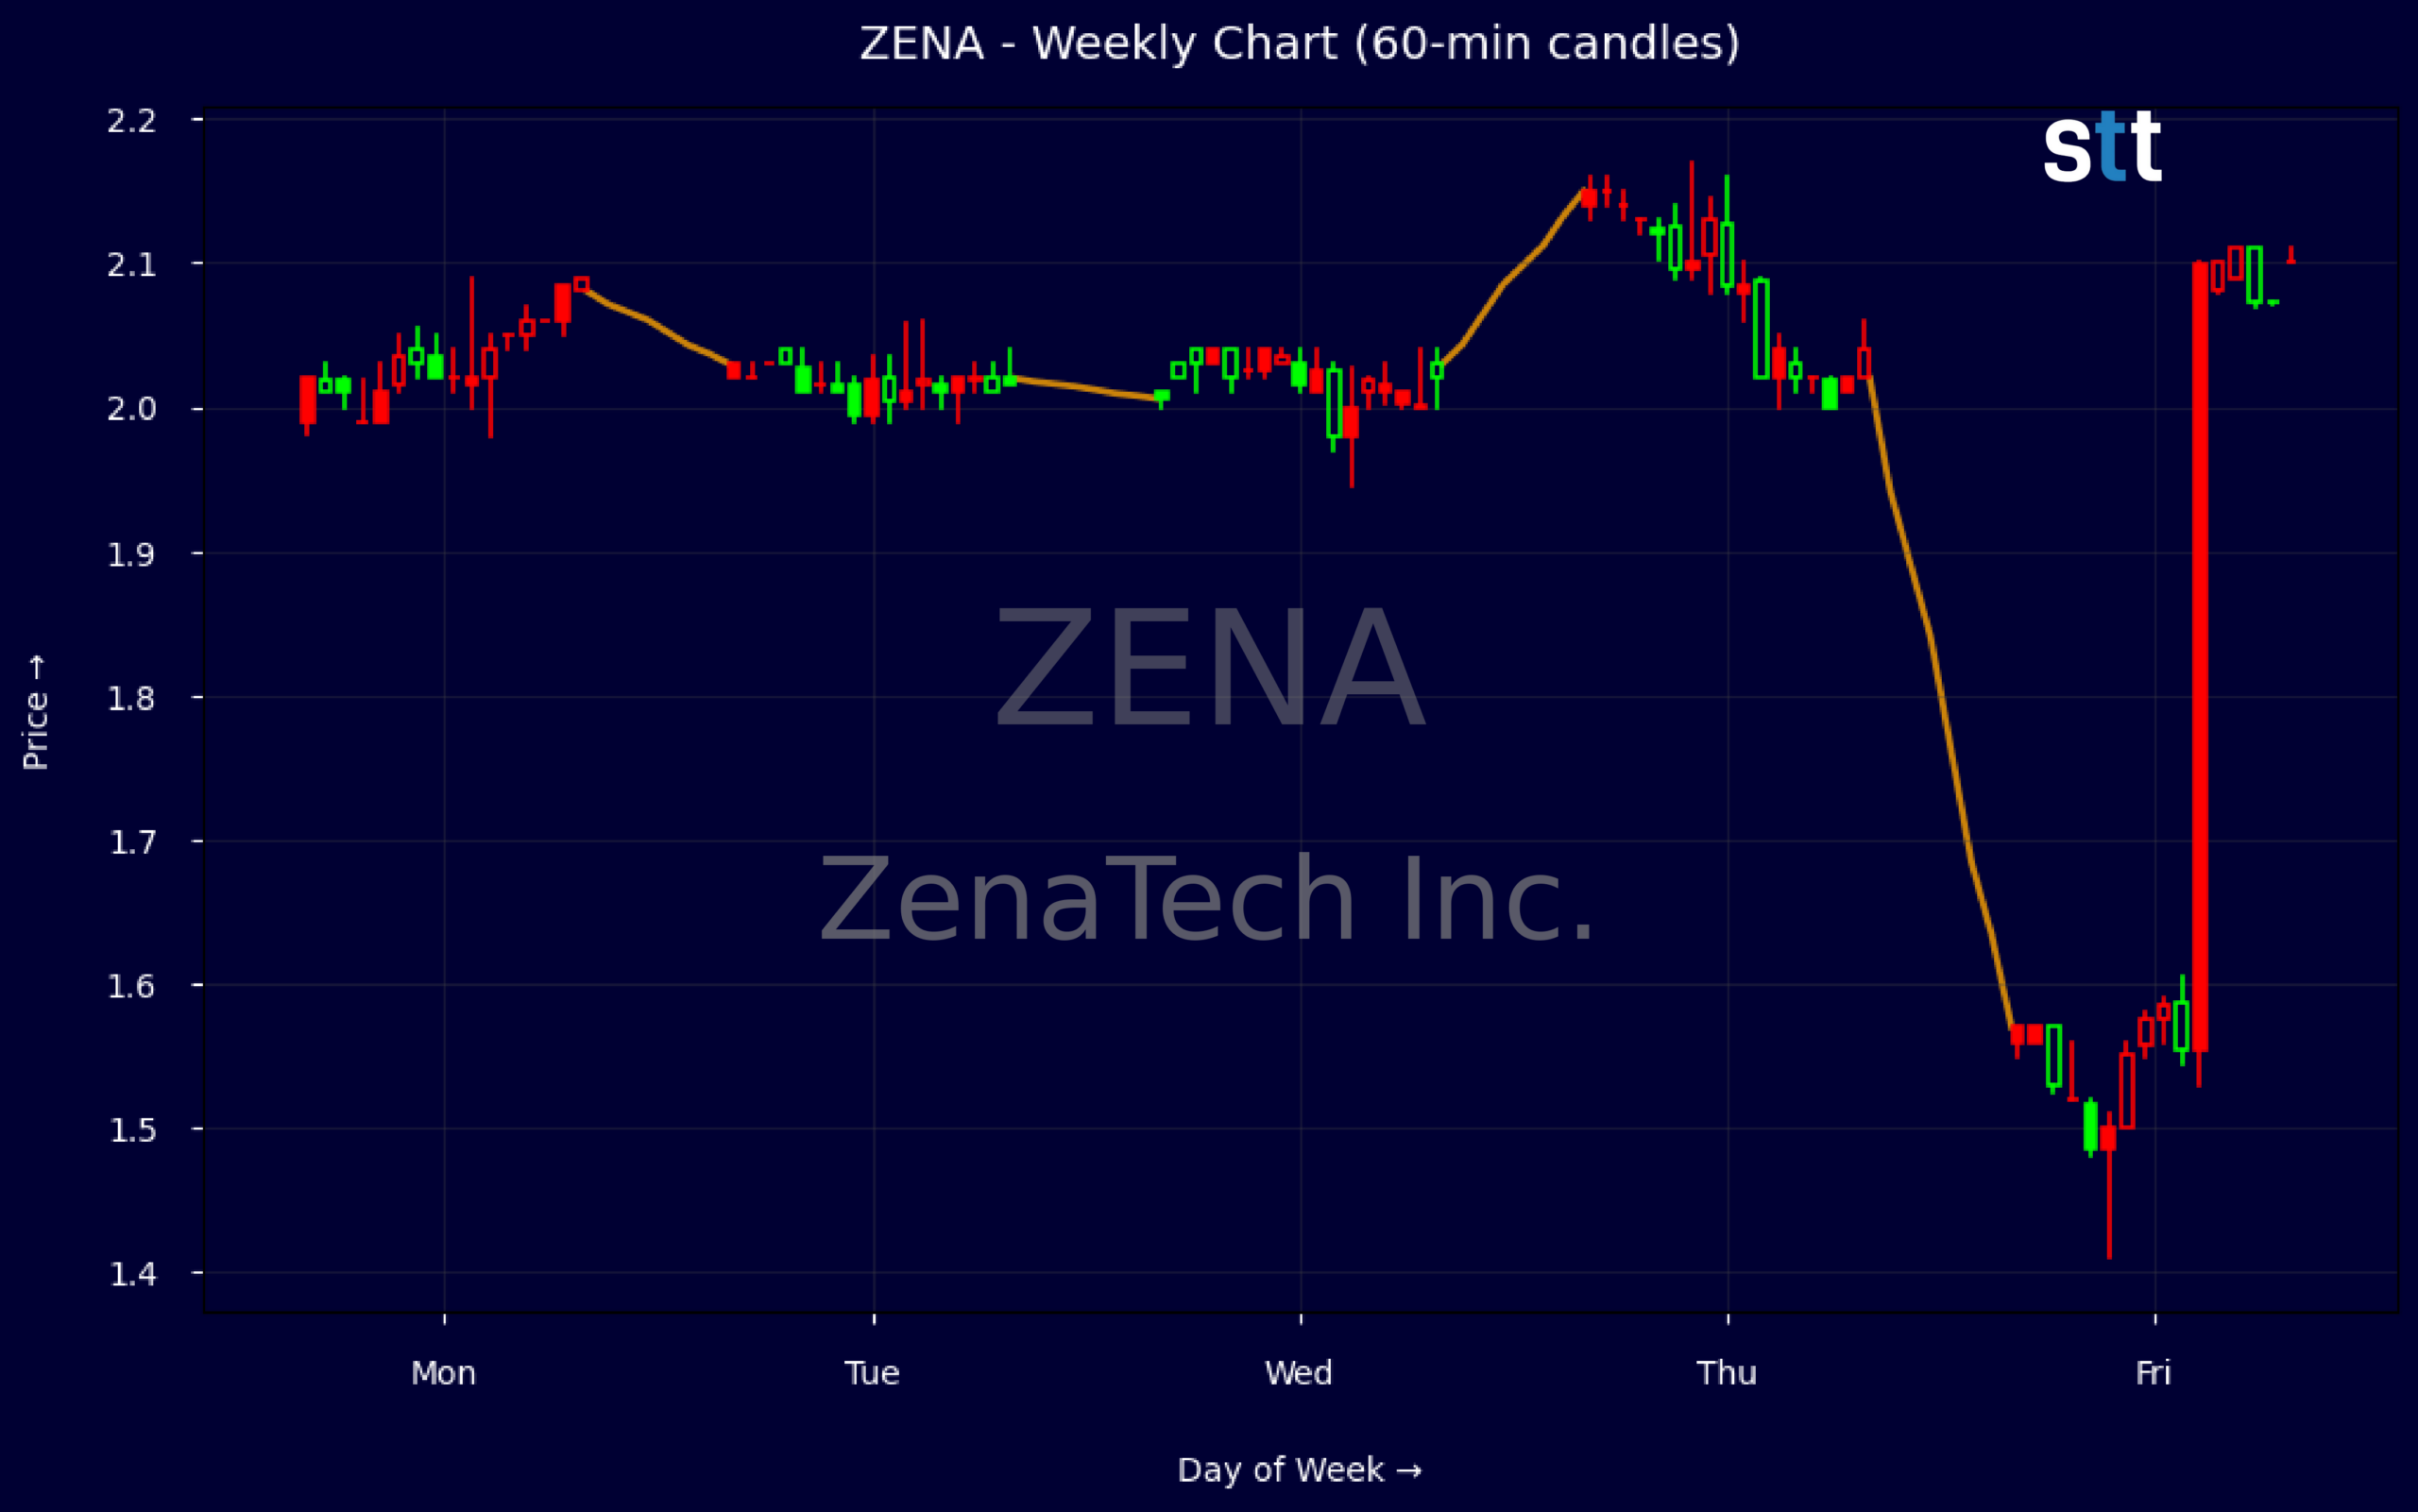
Weekly Update May 11 – May 15, 2026: On Sunday, May 17, 2026 ZenaTech Inc. stock [NASDAQ: ZENA] is trending down by -26.42%! Discover the key drivers behind this movement as well as our expert analysis in the detailed breakdown below.
Technology industry expert:
Analyst sentiment – negative
ZENA operates as a micro-cap software/IT services name with early-stage fundamentals and highly speculative characteristics. Revenue of ~$12.9M and a price-to-sales of 7.7x imply a rich multiple relative to its scale and lack of profitability. Pre-tax margin of -55.3%, ROA of -61%, and ROE of -108% underscore a structurally loss-making model. The balance sheet shows ~$24.2M in cash and only ~$16.8M in long-term obligations, but negative book value (BVPS -0.62) and large accumulated deficits highlight dilution risk.
Technically, ZENA is in a short-term downtrend after a failed breakout. The sequence from 2.04→2.10 closes, then a sharp drop to 1.56, confirms sellers in control and a breakdown from the 2.00–2.10 congestion zone. Intraday 5-minute action (not shown numerically but implied by the large daily range) suggests heavy volume on the flush lower and weak bounces, consistent with distribution. The key actionable level is 1.50: aggressive traders can buy a flush into 1.45–1.55 with a tight stop below 1.40, targeting a mean-reversion move back toward 1.85–1.95.
More Breaking News
- MSTR Stock Holds Key Range As Volatility Tightens
- Rocket Companies RKT Stock Dips As Q3 Earnings Smash Estimates
- PURR Stock Tests Support As Hyperliquid Strategies Cash Pile Stands Out
- GPN Stock Jumps As Wall Street Ups Price Targets
With no identifiable near-term news catalysts, ZENA trades as a pure technical and sentiment-driven micro-cap rather than a fundamentals-led Technology or Software & IT Services compounder. Relative to sector benchmarks, it lags on profitability, scale, and balance-sheet quality, and deserves a speculative-only classification. Near-term resistance sits at 1.95–2.05, where recent supply emerged; support is 1.45–1.55. Base-case 3–6 month trading range is 1.40–2.10, with risk skewed to further dilution or downside if execution does not improve.
Quick Financial Overview
ZenaTech Inc. prints a mixed picture that leans speculative. Revenue of roughly $12.9M against an enterprise value near $106.1M translates into a price-to-sales ratio around 7.7, which is rich for a company not yet profitable. Pretax margin sits near -55%, and returns on equity and assets are both clearly negative, so the current valuation rests more on future expectations than on cash earnings.
The balance sheet, however, gives ZENA some breathing room. Total assets are about $99.8M, with cash and short-term investments above $24.1M and working capital near $18.3M. Long-term debt and capital lease obligations total about $16.8M, which is manageable against equity near $68.0M, though negative book value per share and a negative price-to-book ratio highlight accumulated losses and prior write-downs.
On the chart, weekly prices sit mostly around $2.00, with closes between $2.01 and $2.10 before dropping to $1.56. That move, combined with the intraday 5‑minute candle that opened near $1.80 and flushed to about $1.41 before closing at $1.52, shows a sharp shift from steady consolidation to high volatility. For short-term traders, this transition from a quiet $2.00 range into fast downside action is the key technical shift to respect.
Conclusion
This is stock news, not investment advice. StocksToTrade News delivers real-time stock market updates tailored to highlight the key catalysts driving short-term price movements. Our coverage is designed for active traders and investors who thrive in fast-moving markets, with a focus on volatile sectors like penny stocks, AI stocks, Robinhood stocks and other momentum plays. From earnings reports and FDA approvals to mergers, new contracts, and unusual trading volume, we break down the events that can spark significant price action.
Looking to level up your trading game? Explore StocksToTrade, the ultimate platform for traders. With powerful tools designed for swing and day trading, integrated news scanning, and even social media monitoring, StocksToTrade keeps you one step ahead.
Check out our quick startup guide for new traders!
- How to Read Stock Charts: A Guide for Beginners
- Trading Plan: 6 Steps to Create One
- How To Create a Stock Watchlist
Ready to build your watchlists? Check out these curated lists:
Once your watchlist is set, take the next step and trade with confidence using StocksToTrade’s robust platform. Don’t miss out — grab your 14-day trial for just $7 and experience the edge you need to thrive in today’s fast-paced markets.