

ZenaTech Inc. faces intensified regulatory scrutiny on its flagship AI platform, and stocks have been trading down by -26.42 percent.
Market Insights For Active ZENA Traders
- Recent weekly candles show ZENA stuck near $2, with a failed push above $2.15 followed by a sharp breakdown.
- Intraday action shows a violent drop from around $1.85 to a low near $1.41, signaling aggressive selling pressure.
- Valuation remains rich with a price-to-sales near 10.8 despite negative profitability metrics.
- Balance sheet shows around $24.2M in cash and a modest liability load, giving ZenaTech Inc. some breathing room.
- Traders are watching whether the $1.50–$2.00 zone becomes a base or breaks into a deeper downtrend.
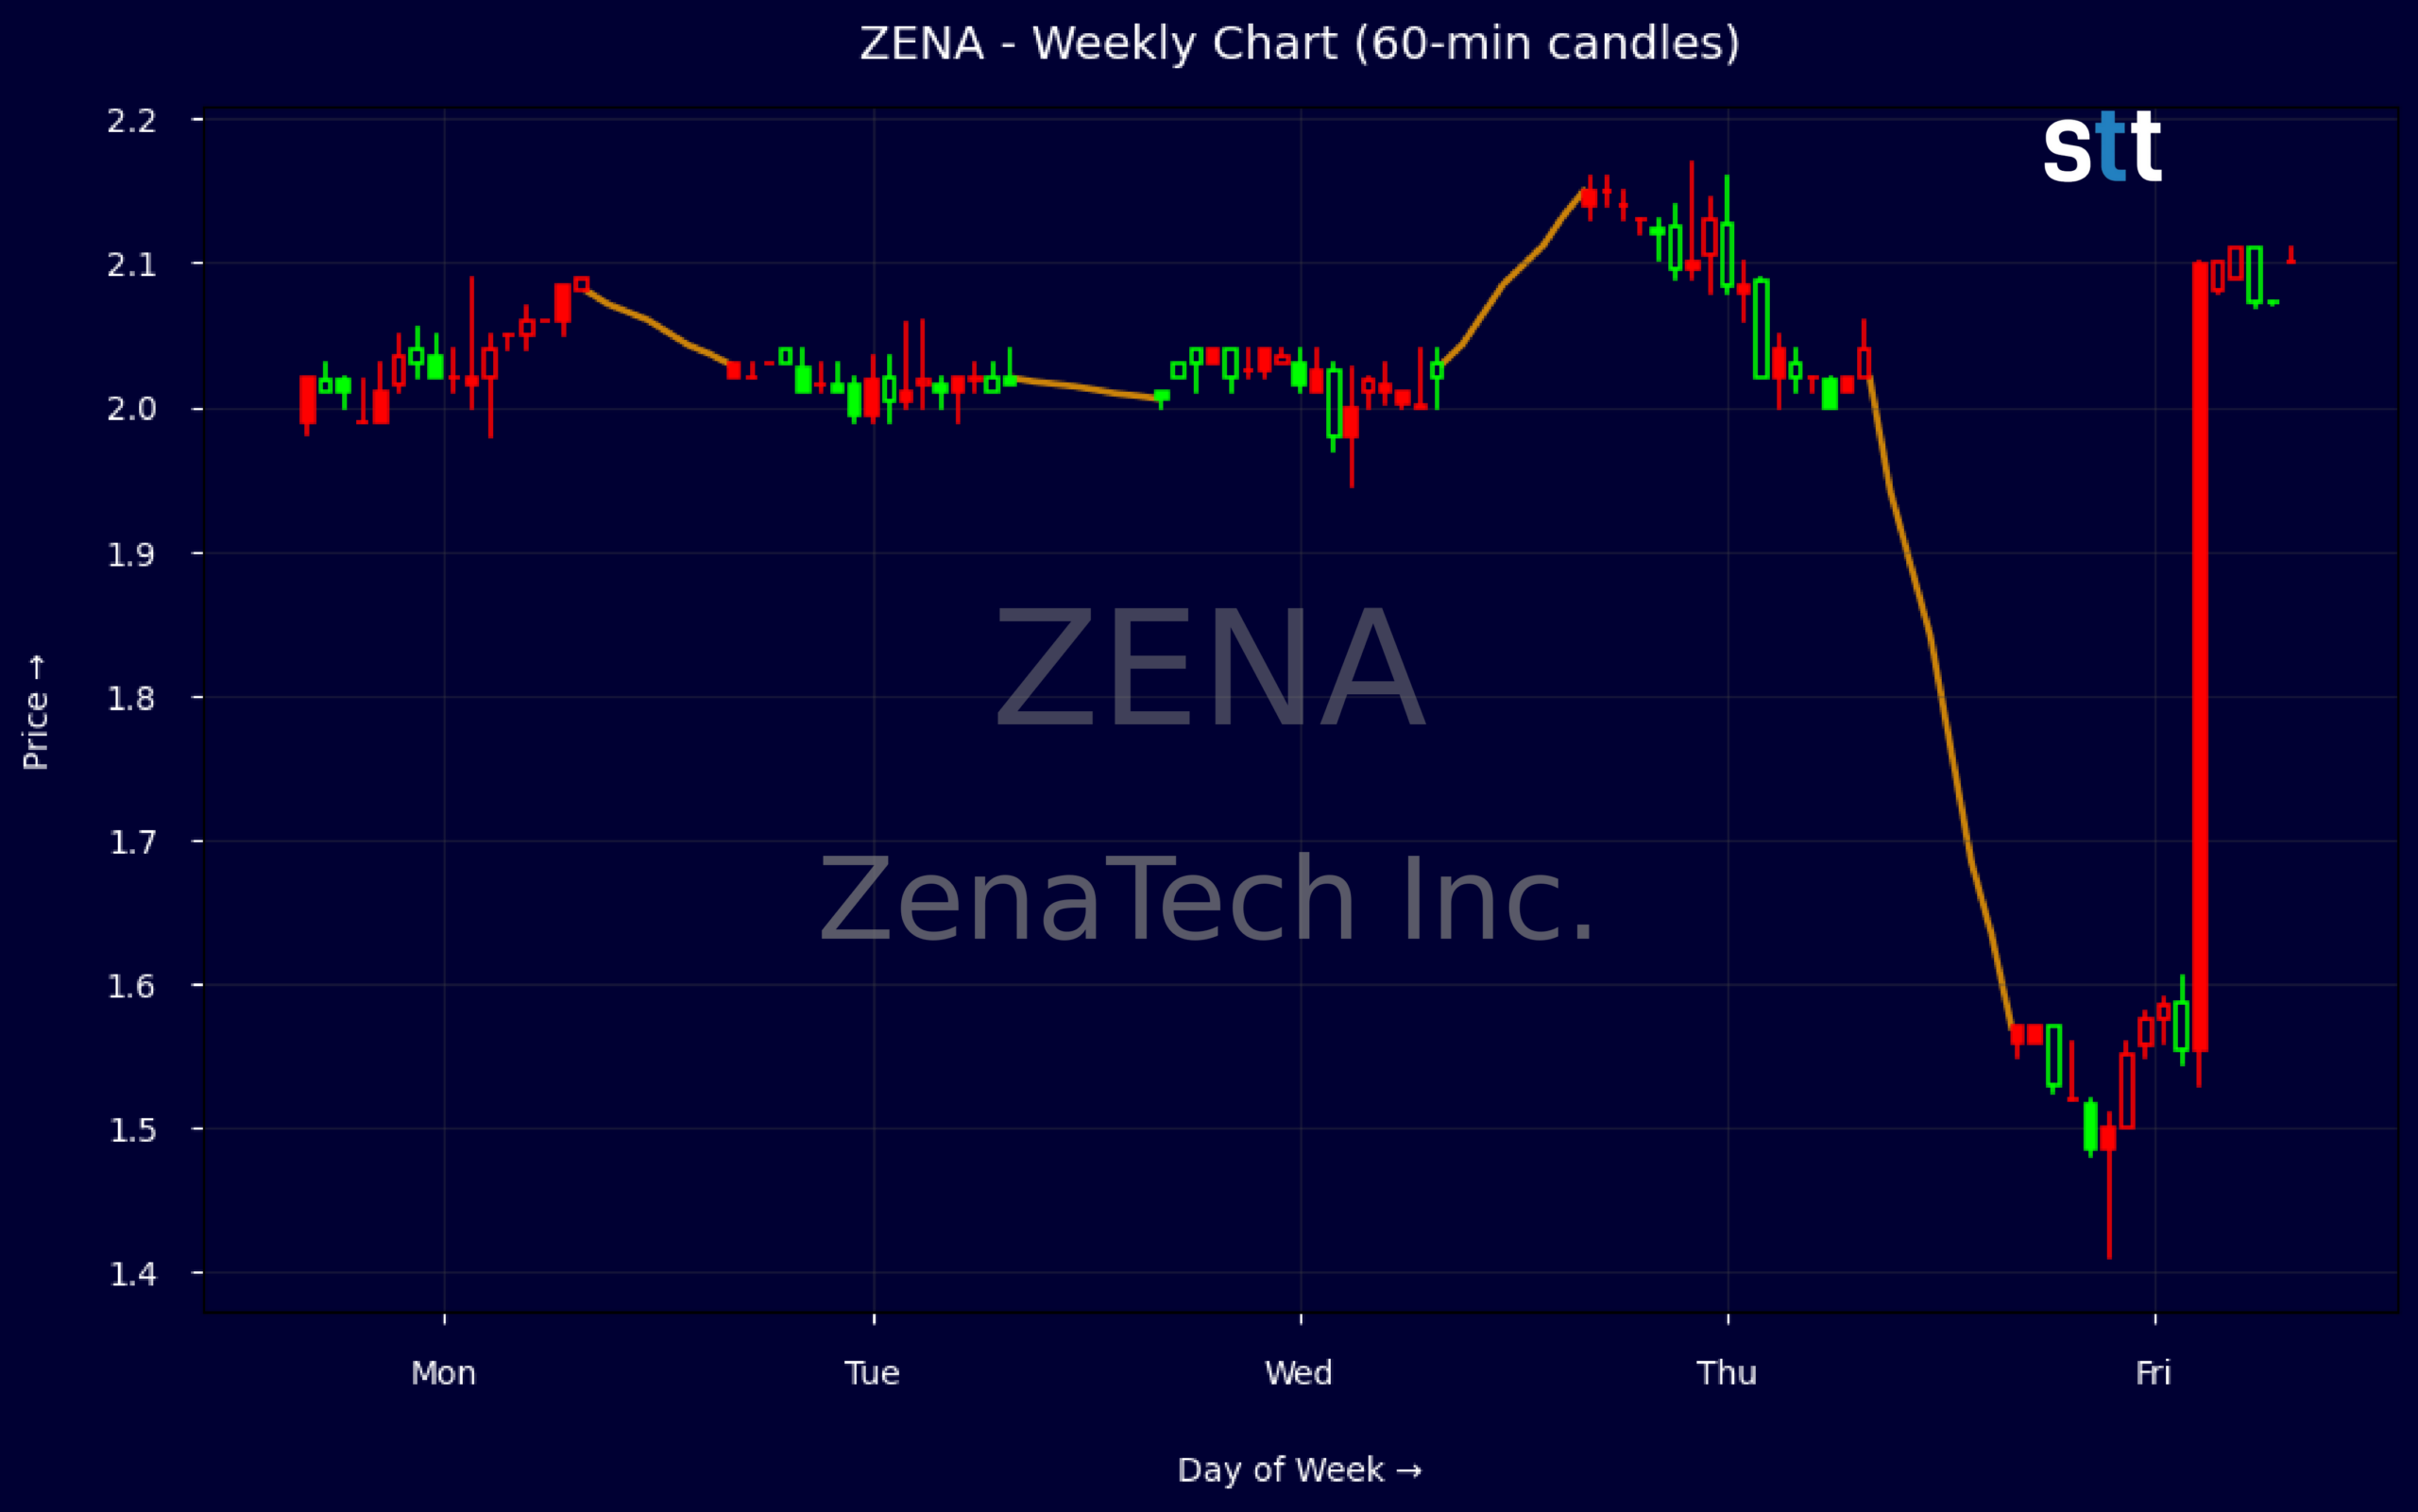
Weekly Update May 11 – May 15, 2026: On Saturday, May 16, 2026 ZenaTech Inc. stock [NASDAQ: ZENA] is trending down by -26.42%! Discover the key drivers behind this movement as well as our expert analysis in the detailed breakdown below.
Technology industry expert:
Analyst sentiment – negative
ZENA’s fundamentals reflect an early-stage, capital‑intensive software/IT services business with weak profitability and a stretched valuation. Revenue of ~$12.9M and price-to-sales of 10.8x are rich versus sector peers, especially with a pre-tax margin of -55.3% and deeply negative ROA (-0.61) and ROE (-1.08). Equity is positive at ~$68M but underpinned by heavy intangibles and preferred stock; long-term debt and capital leases (~$16.8M) keep leverage manageable (LT debt-to-capital ~0.31) but leave little room for execution missteps.
Technically, ZENA’s recent weekly tape shows a sharp breakdown: a failed push to 2.16 followed by an air-pocket to a 1.52 low, with the week closing weak at 1.56. That pattern indicates a clear short-term downtrend and failed breakout, likely on elevated volume near 2.10–2.16. The actionable level is resistance at 2.00–2.05; rallies into that band are short entries with stops above 2.20, while tactical buyers only step in on consolidation above 2.05 with improving intraday volume.
More Breaking News
- CareDx CDNA Rips Higher After Big Earnings Beat And Guidance Hike
- CETX Stock Whipsaws As Traders Target Volatile Penny Name
- NU Stock Plunges Nearly 20% As Volatility Spikes
- BBAI Stock Pops As BigBear.ai Lands $225M In Federal AI Deals
With no material news flow, ZENA trades purely on technicals and speculative growth expectations, lagging Technology and Software & IT Services benchmarks on profitability, scale, and balance-sheet quality. The combination of negative margins, high PS multiple, and intangibles-heavy equity warrants a defensive stance. Near term, resistance sits at 2.00–2.05 and 2.20, with support at 1.50; base-case trading range is 1.50–2.00, skewed lower unless management demonstrates a credible path to breakeven.
Quick Financial Overview
ZenaTech Inc. (ZENA) is trading in a tight but fragile range, with weekly closes hovering near $2. The stock tried to break higher on 2026/05/14, touching about $2.16, but that move failed and price slid to a $1.56 close by 2026/05/15. That reversal, from a brief pop to a firm breakdown, tells traders momentum flipped from cautious optimism to clear selling control.
Intraday, the 5-minute candle shows an even more aggressive story. Price opened near $1.80–$1.85, spiked slightly, then flushed down to about $1.41 before bouncing to a $1.52 close. That type of intraday range and weak close signals trapped late longs and short-term fear, often leading to continued choppy trade as the market digests excess supply.
Financially, ZenaTech Inc. posted revenue of roughly $12.9M, but the pretax profit margin sits near -55.3%, pointing to a business still far from scale. With an enterprise value around $106.2M, the price-to-sales near 10.8 is steep for a company with negative returns on assets of about -0.61 and return on equity near -1.08. The balance sheet shows total assets close to $99.8M, equity about $68.0M, and total liabilities around $31.8M, with cash and short-term investments near $24.2M providing runway but not offsetting current operating losses.
Conclusion
This is stock news, not investment advice. StocksToTrade News delivers real-time stock market updates tailored to highlight the key catalysts driving short-term price movements. Our coverage is designed for active traders and investors who thrive in fast-moving markets, with a focus on volatile sectors like penny stocks, AI stocks, Robinhood stocks and other momentum plays. From earnings reports and FDA approvals to mergers, new contracts, and unusual trading volume, we break down the events that can spark significant price action.
Looking to level up your trading game? Explore StocksToTrade, the ultimate platform for traders. With powerful tools designed for swing and day trading, integrated news scanning, and even social media monitoring, StocksToTrade keeps you one step ahead.
Check out our quick startup guide for new traders!
- How to Read Stock Charts: A Guide for Beginners
- Trading Plan: 6 Steps to Create One
- How To Create a Stock Watchlist
Ready to build your watchlists? Check out these curated lists:
Once your watchlist is set, take the next step and trade with confidence using StocksToTrade’s robust platform. Don’t miss out — grab your 14-day trial for just $7 and experience the edge you need to thrive in today’s fast-paced markets.