

XTI Aerospace Inc. Common Stock, pressured by negative sentiment around its latest financing and dilution risks, has been trading down by -14.97 percent.
Market Insights For Active XTIA Traders
- Price action in XTI Aerospace Inc. Common Stock has turned choppy, with a sharp intraday fade from above $2.10 to around $1.80 signaling aggressive selling.
- Recent weekly candles show a failed push toward $2.20 followed by a hard drop under prior support, keeping XTIA in a fragile short-term trend.
- Financials reveal solid revenue growth but extremely deep losses and negative equity, a mix that often fuels both sharp rallies and fast selloffs.
- Liquidity ratios sit well below 1.0, so any funding or balance sheet shift could quickly change how traders price XTIA risk.
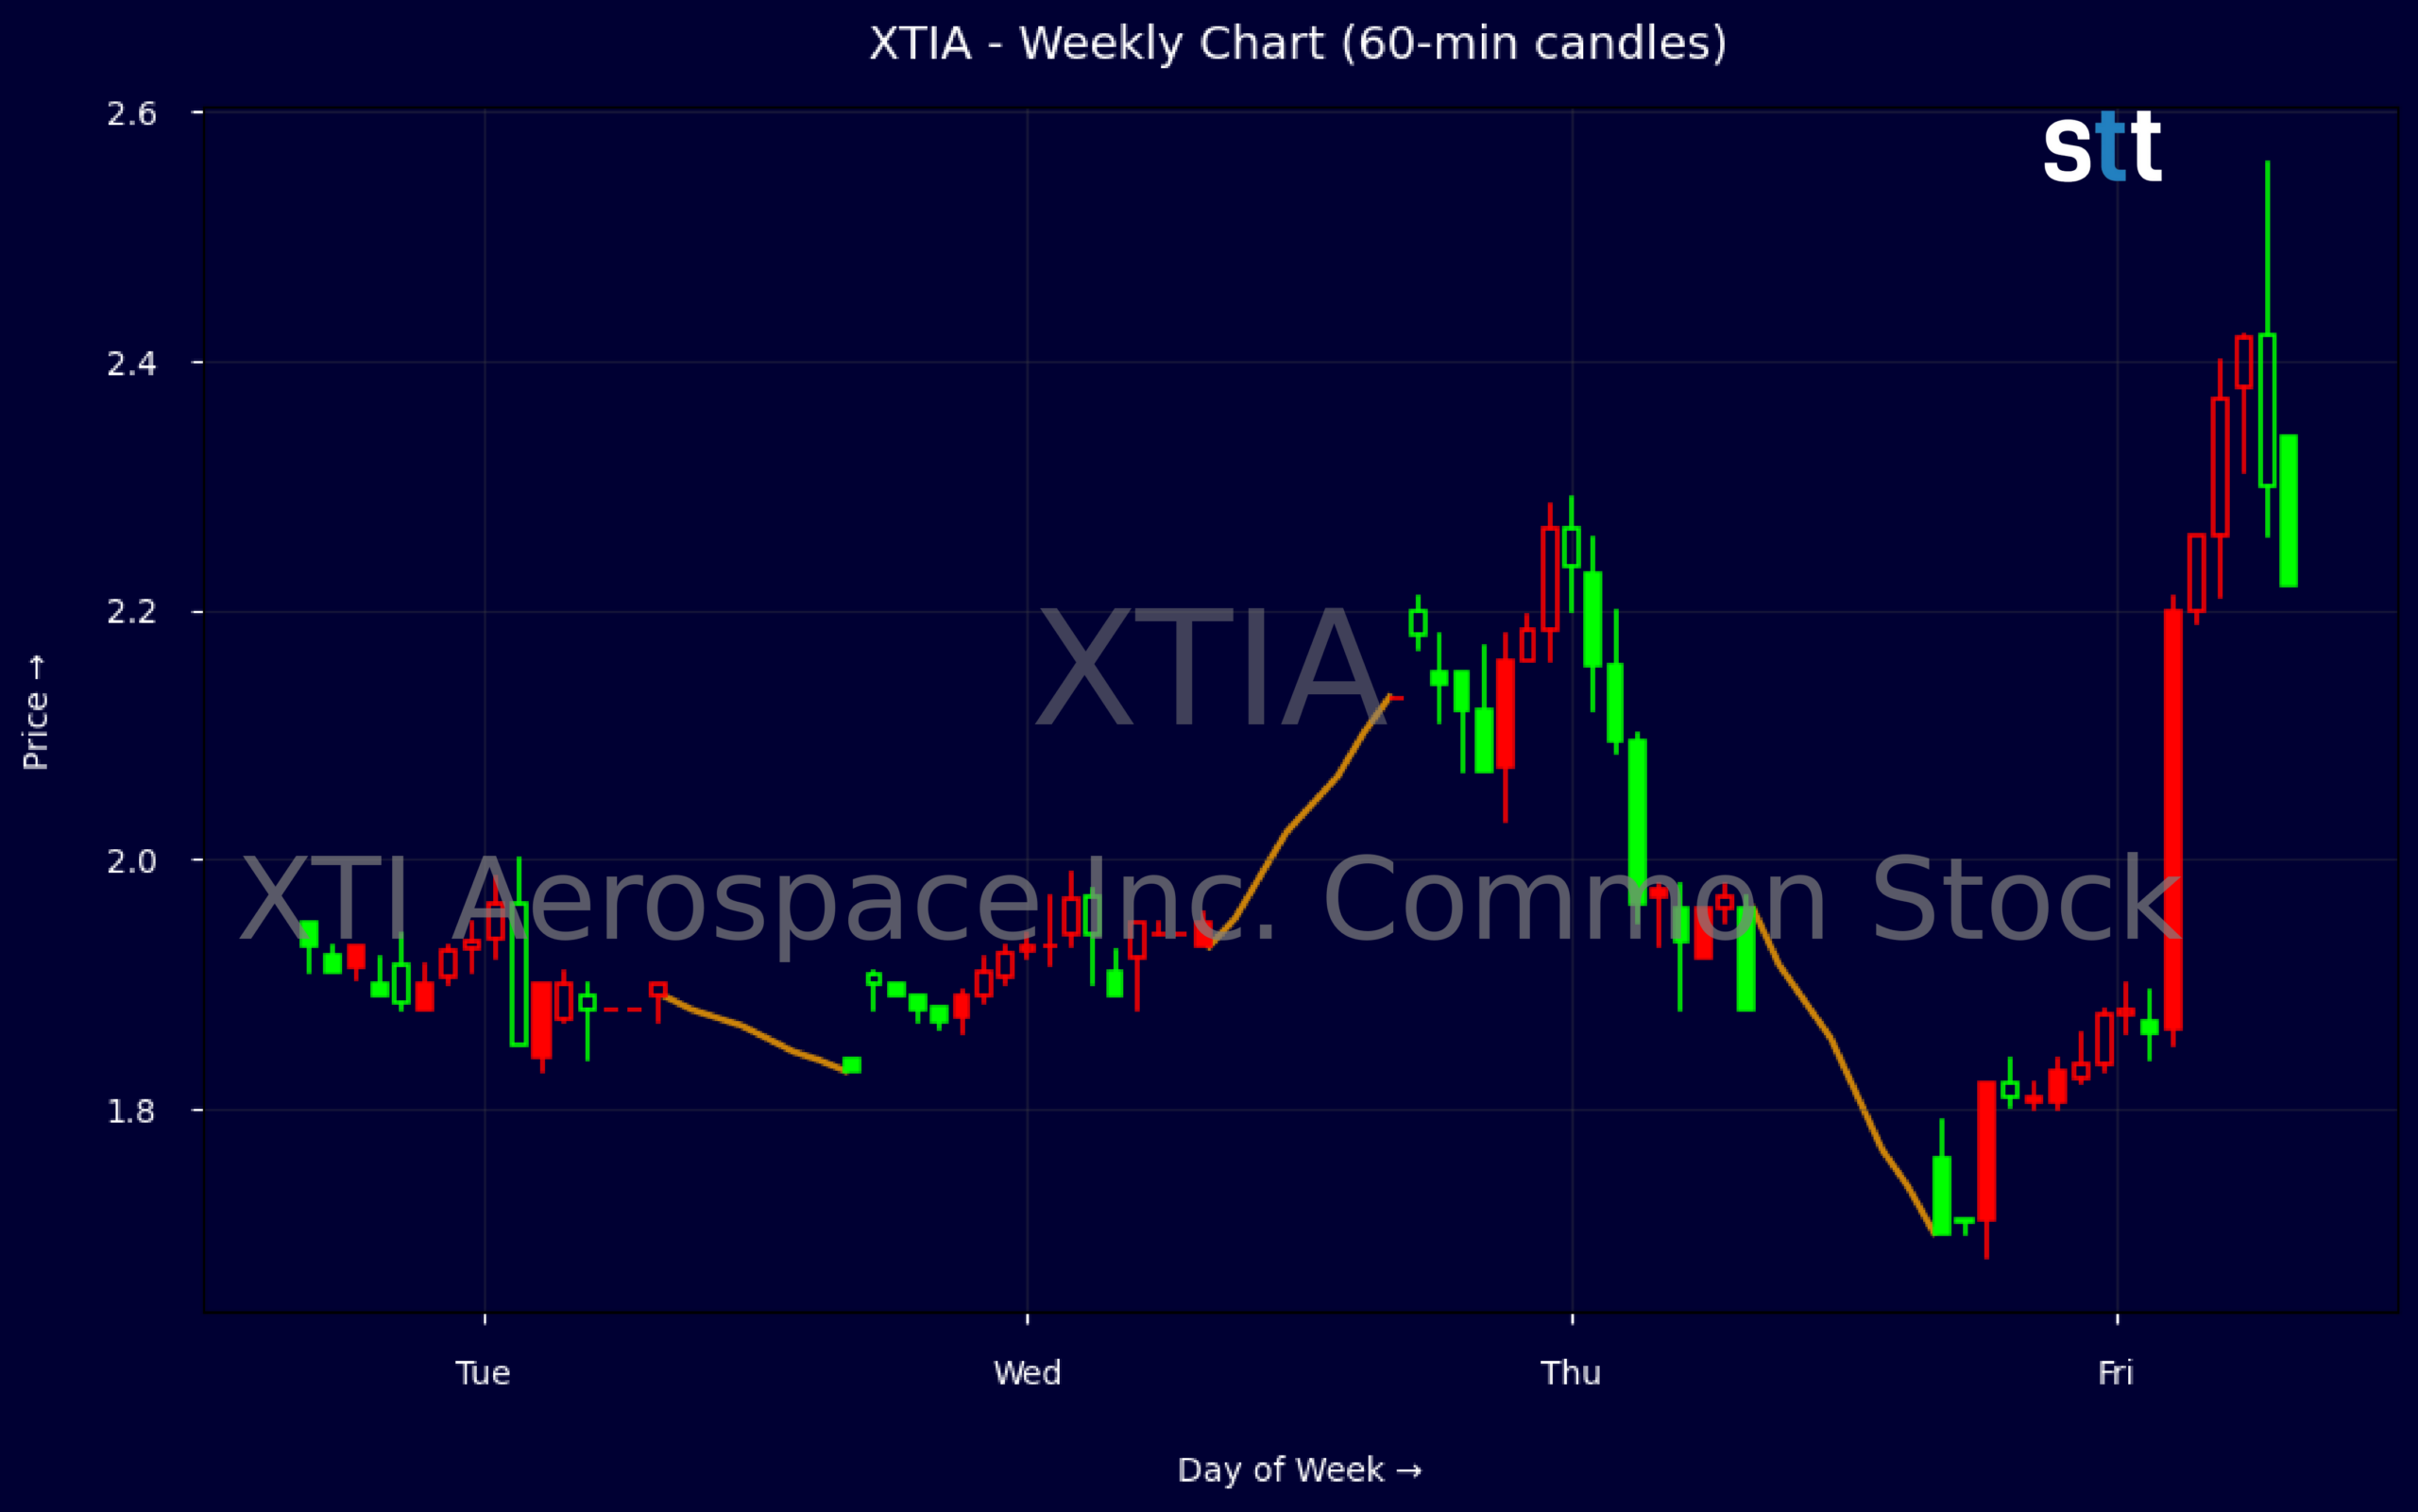
Weekly Update May 25 – May 29, 2026: On Sunday, May 31, 2026 XTI Aerospace Inc. Common Stock stock [NASDAQ: XTIA] is trending down by -14.97%! Discover the key drivers behind this movement as well as our expert analysis in the detailed breakdown below.
Industrials industry expert:
Analyst sentiment – negative
XTIA operates from an extremely weak fundamental position despite decent top-line growth (3-year CAGR ~59%). Gross margin of ~20% is overwhelmed by deeply negative EBIT margin (-144%) and ROA (<-100%), with FY losses of ~$35m on ~$27.7m revenue. Liquidity is strained (current ratio 0.6, quick 0.3, working capital deficit >$40m), equity is negative, and cash burn is severe (LTM FCF roughly -$10m+ per quarter), forcing reliance on dilutive equity and debt financing.
Technically, XTIA is in a short-term downtrend after a failed breakout above $2.20. The weekly tape shows a spike to 2.21 followed by a sharp reversal to close near 1.76, confirming supply overhead and weak demand. Intraday 5-minute candles (not shown but implied by range and close) indicate selling into strength with fading volume on bounces. Key actionable level: $1.70 support; a decisive break with volume opens downside toward $1.40, while any tactical short entries are attractive below $1.95 with tight risk.
More Breaking News
- FDXF Stock Climbs As Price Action Attracts Momentum Traders
- SPCX Slides As Headline Risk And Competition Hammer Sentiment
- Regeneron Stock Jumps As Libtayo Data Fuels Bullish Targets
- RIG Stock Climbs As Backlog And Valaris Deal Transform Outlook
With no material positive news flow and fundamentals far below Industrials and Aerospace & Defense peers on profitability, balance sheet quality, and returns, XTIA screens as a high-risk capital structure story, not a core holding. Peers trade on solid ROIC and positive FCF; XTIA sits on negative equity and persistent losses. Tactical traders can trade the range: resistance $2.00–2.20, support $1.60–1.70. Strategic stance is underweight/avoid pending credible balance sheet repair and sustainable margin improvement.
Quick Financial Overview
Weekly data for XTIA shows a clear volatility spike. After trading around $1.96–$1.90 early in the period, XTI Aerospace Inc. Common Stock surged to the $2.13–$2.21 area before reversing sharply and finishing the week near $1.76. That failed breakout and close near the lows is a classic sign that short-term buyers lost control and profit-taking or new selling hit the tape.
Intraday, the 5-minute snapshot reinforces that story. Price opened near $2.11, briefly pushed to $2.13, then sold off into the high $1.70s with little sign of a strong bounce. For active traders, that kind of straight-line drop after a push over $2.00 often marks a sentiment shift from momentum chasing to risk-off, and it puts the prior support band near $1.80–$1.90 in focus.
On the fundamental side, XTIA generated about $22.49M in revenue with strong multi-year growth, but margins are deeply negative. EBIT margin around -144% and profit margin near -184% show the business is burning cash rather than generating it. The balance sheet is stretched: current ratio of 0.6 and quick ratio of 0.3 mean near-term obligations lean heavy versus liquid assets, while working capital of roughly -$40.6M and negative equity underline financial stress.
Cash flow data backs that up. Operating cash flow was about -$10.45M for the recent quarter, with free cash flow near -$10.59M despite modest capital spending. XTI Aerospace Inc. Common Stock is effectively being sustained by financing flows, including over $7.4M from warrant issuance and net short-term debt issuance to plug the gap. For traders, this combination of high revenue growth, heavy losses, and financing dependence often sets up a binary profile: sharp squeezes on any positive catalyst and steep air pockets if funding or confidence wobbles.
Conclusion
XTIA sits at the intersection of weak technicals and stressed fundamentals, which is exactly the kind of battleground short-term traders gravitate toward. The recent rejection above $2.10 and weekly close near $1.76 tell you that supply is in control for now, and that prior support around $1.80–$1.90 has turned into a key pivot zone. If price can reclaim and hold above that band on rising volume, the door opens for a reflex bounce; if not, traders should respect the risk of further downside. As Tim Bohen, lead trainer with StocksToTrade says, “If a stock’s in play today, it’s because of volume. Low volume doesn’t interest me, because I can’t trust the moves.” In XTIA’s case, that means any reclaim of key levels without convincing volume is suspect and should be treated as noise rather than a reliable signal for trading.
From a financial standpoint, XTI Aerospace Inc. Common Stock offers revenue growth but carries extreme losses, negative book value, and a thin liquidity cushion. That backdrop tends to amplify moves in both directions because each rumor about funding, contracts, or cost cuts can shift risk perception quickly. For short-term players, the trade is less about business quality today and more about timing entries around those swings while managing size tightly.
XTIA will likely stay a high-beta name where discipline matters more than conviction. Traders should define their levels in advance and avoid assuming any floor just because the stock feels “cheap” on price alone. As I tell my own students, “In names like XTI Aerospace Inc. Common Stock, the edge doesn’t come from predicting the future — it comes from respecting the risk and trading the levels the chart is already giving you.””,”scores”:{“risk-level”:”high”},”trade”:”true
This is stock news, not investment advice. StocksToTrade News delivers real-time stock market updates tailored to highlight the key catalysts driving short-term price movements. Our coverage is designed for active traders and investors who thrive in fast-moving markets, with a focus on volatile sectors like penny stocks, AI stocks, Robinhood stocks and other momentum plays. From earnings reports and FDA approvals to mergers, new contracts, and unusual trading volume, we break down the events that can spark significant price action.
Looking to level up your trading game? Explore StocksToTrade, the ultimate platform for traders. With powerful tools designed for swing and day trading, integrated news scanning, and even social media monitoring, StocksToTrade keeps you one step ahead.
Check out our quick startup guide for new traders!
- How to Read Stock Charts: A Guide for Beginners
- Trading Plan: 6 Steps to Create One
- How To Create a Stock Watchlist
Ready to build your watchlists? Check out these curated lists:
Once your watchlist is set, take the next step and trade with confidence using StocksToTrade’s robust platform. Don’t miss out — grab your 14-day trial for just $7 and experience the edge you need to thrive in today’s fast-paced markets.