

Tandem Diabetes Care Inc. stocks have been trading down by -15.48 percent following negative sentiment over its diabetes device outlook.
What Traders Need To Know
- Price collapsed from above $20 to the mid-$15s intraday, flashing aggressive selling pressure.
- Weekly candles show a sharp reversal after a push toward $21, suggesting failed breakout energy.
- Revenue is above $1.0B annually, but Tandem Diabetes Care Inc. is still running negative margins.
- Heavy leverage and weak returns on equity keep TNDM squarely in higher-risk territory.
- Short-term traders are watching for a bounce vs. further breakdown around the mid-teens.
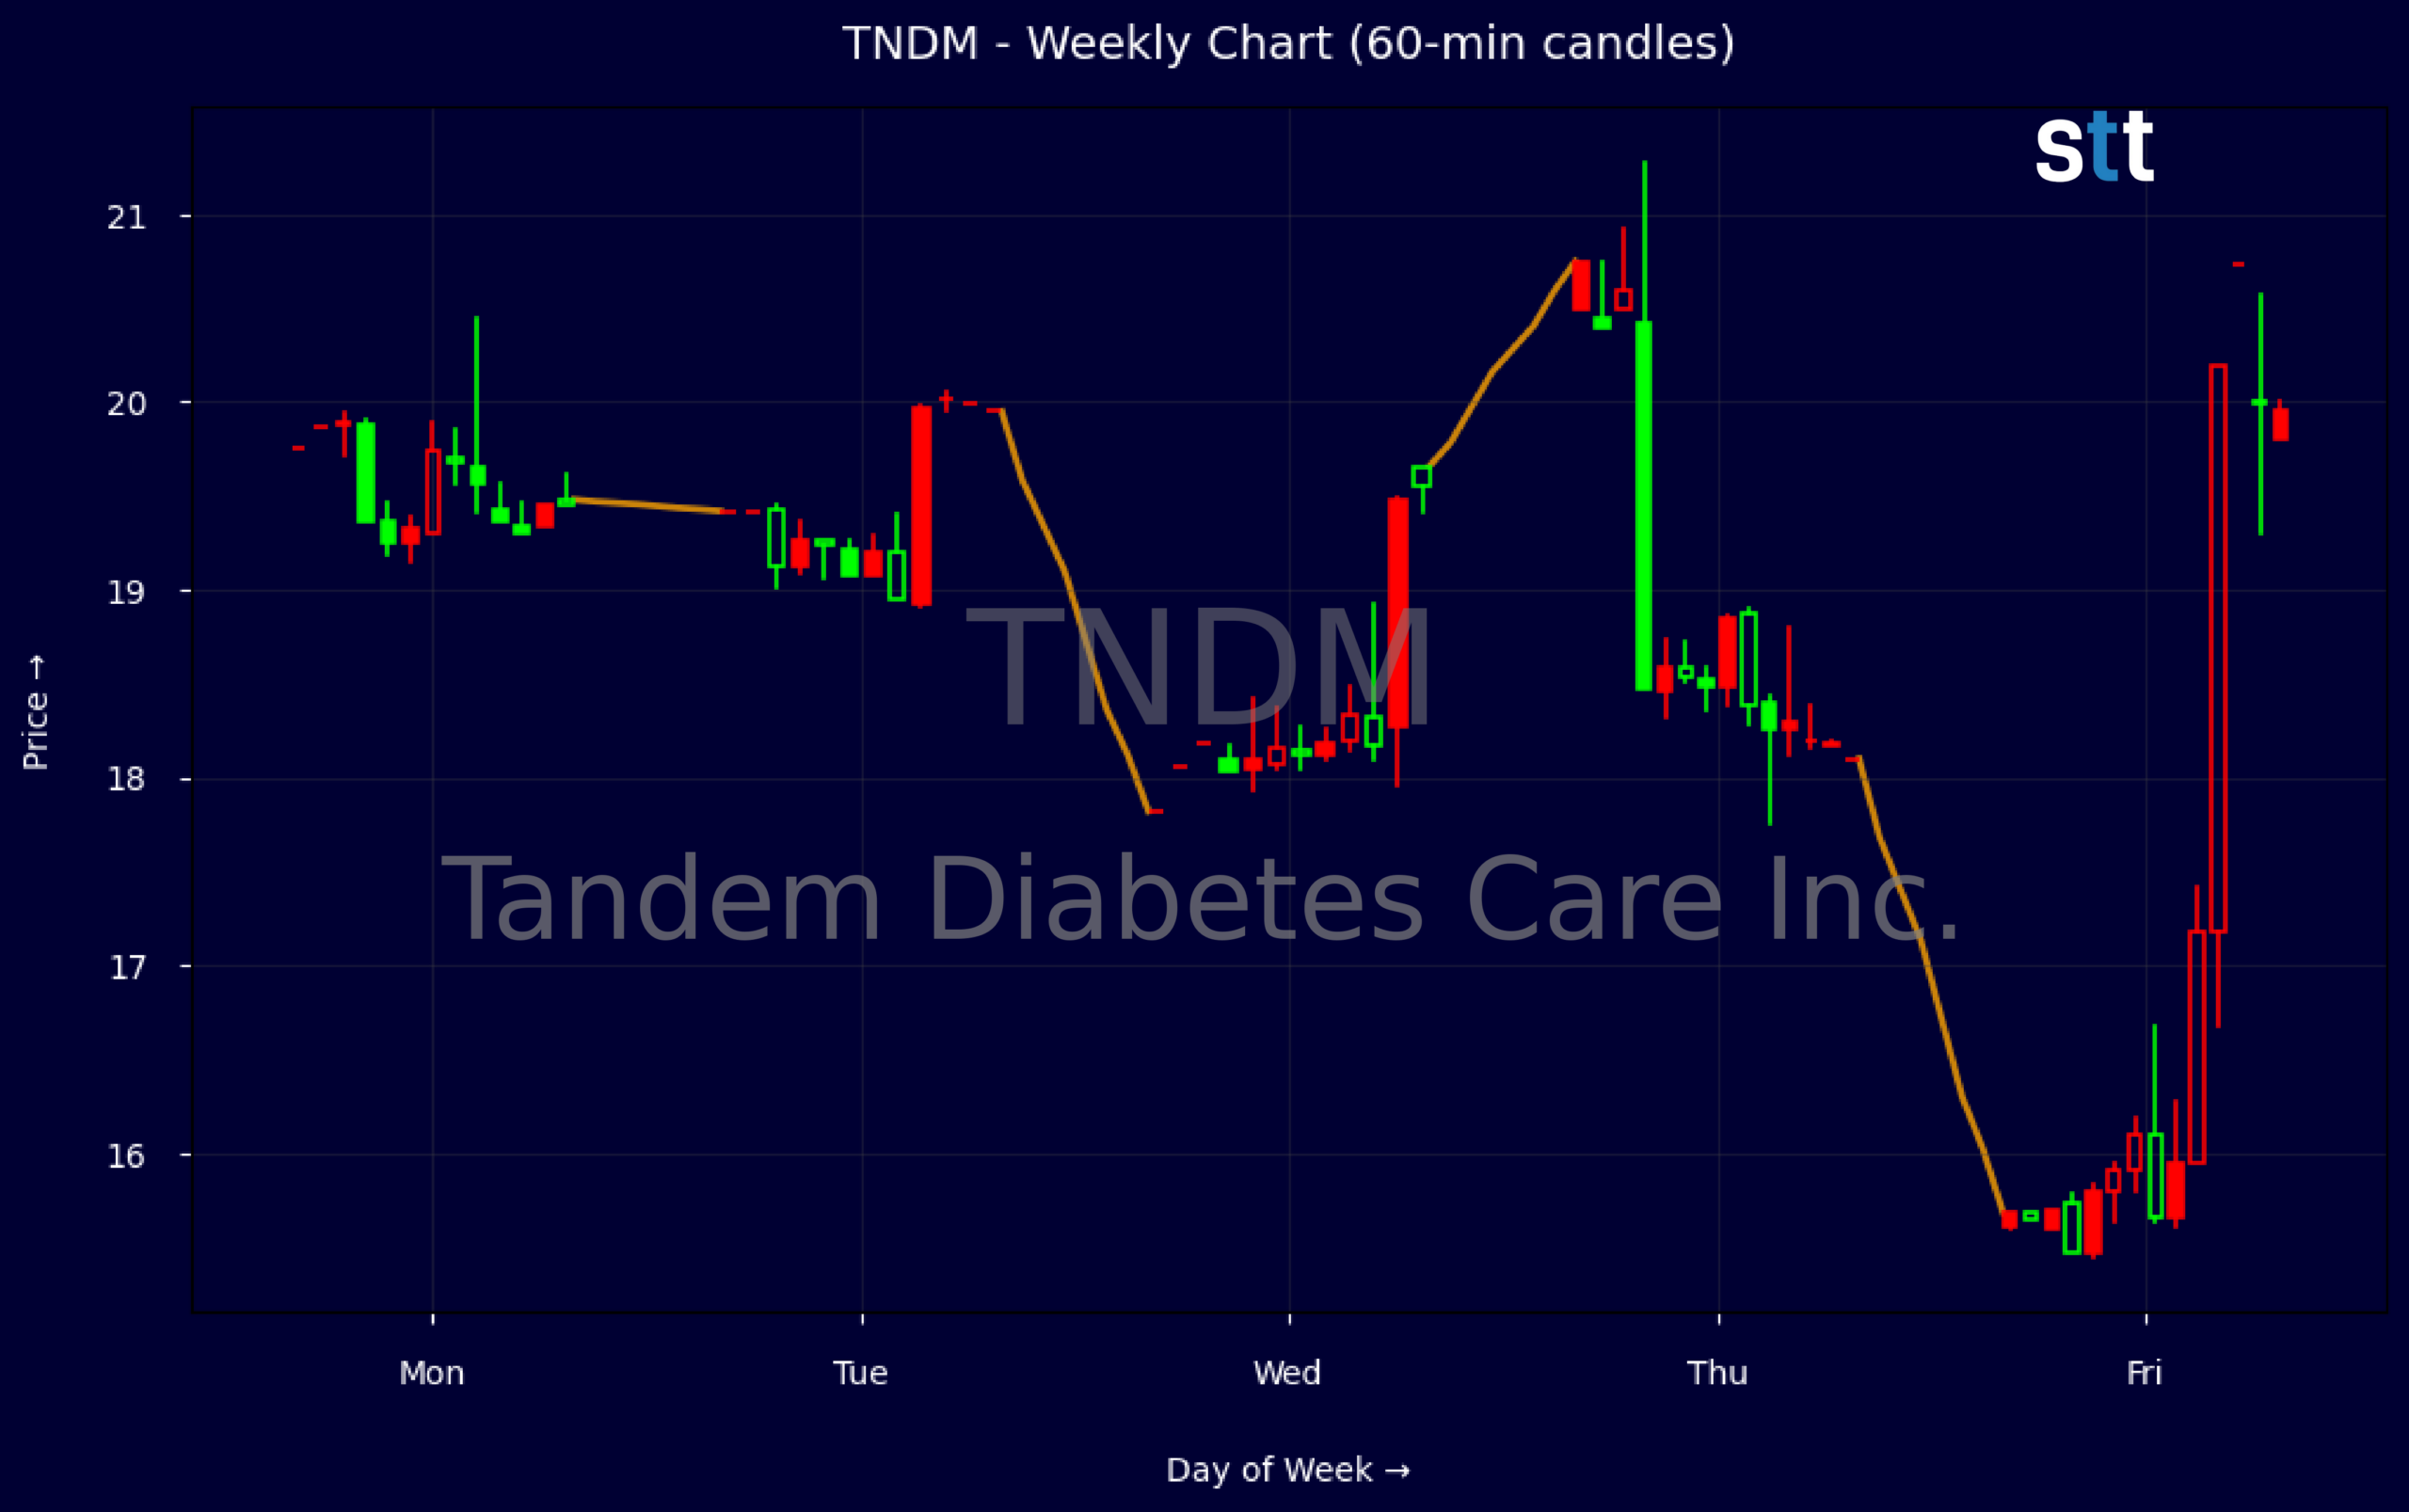
Weekly Update May 04 – May 08, 2026: On Sunday, May 10, 2026 Tandem Diabetes Care Inc. stock [NASDAQ: TNDM] is trending down by -15.48%! Discover the key drivers behind this movement as well as our expert analysis in the detailed breakdown below.
Healthcare industry expert:
Analyst sentiment – negative
Tandem Diabetes Care (TNDM) holds a defensible niche in insulin pumps, supported by strong 53.8% gross margins and double‑digit multi‑year revenue CAGRs (8.2% three‑year, 15.3% five‑year), but profitability remains poor with EBIT margin at –18.9% and profit margin at –20.2%. Returns on equity and assets are deeply negative, reflecting accumulated losses and equity erosion. Leverage is high (total debt/equity 2.86, long‑term debt/capital 73%), though liquidity is comfortable (current ratio 2.6, quick 1.9). Recent quarter free cash flow turned slightly positive at $4.8M and operating cash flow $11.1M, but this improvement is flattered by working‑capital and stock‑based comp, not structural profitability.
Price action shows pronounced volatility and a clear breakdown. The stock fell from an intraday high above 21.25 to a close at 15.61 within days, with a key failed breakout around 21.28 followed by heavy selling and a gap lower. Weekly sequence (19.87 → 19.42 → 17.82 → 20.50 → 15.61) confirms a sharp bearish reversal with expanding range, indicating strong supply. Intraday 5‑minute candles (not shown numerically here) have featured selling into bounces, reinforcing a downtrend. The first actionable trading level is resistance at 20.50–21.00; short entries near that zone with tight risk control are favored while price remains below it, with initial downside focus toward the mid‑teens.
More Breaking News
- CareDx CDNA Rips Higher After Big Earnings Beat And Guidance Hike
- RIG Stock Builds Massive Backlog As Valaris Deal Nears Close
- No Analysis Provided
- PURR Stock Tests Support As Hyperliquid Strategies Cash Pile Stands Out
Near‑term catalysts are limited, with no fresh company‑specific news, so trading is driven by sentiment toward diabetes technology, rates, and risk assets. Versus broader Healthcare and Medical Equipment & Supplies indices, TNDM trades on a low price‑to‑sales (~1.0x) but high price‑to‑free‑cash and weak returns, justifying a discount until sustainable profitability is evident. Debt load and negative margins cap upside versus peers like DXCM and PODD. I see fair value in the $13–16 range near term, with support around $14 and resistance anchored at $20–21; risk‑reward currently skews to the downside.
Quick Financial Overview
TNDM, the stock of Tandem Diabetes Care Inc., shows the classic mix of solid top-line scale with weak bottom-line performance. Revenue sits around $1.01B, with revenue per share near $14.81 and double-digit revenue growth over three and five years. The gross margin near 53.8% is strong for a medical device name, but that advantage is not turning into profits yet, with profit margins around -20% and negative returns on assets and equity.
On the balance sheet, TNDM carries notable leverage. Total debt to equity near 2.86 and a leverage ratio of 5.7 tell traders this is not a low-risk balance sheet. The current ratio of 2.6 and quick ratio of 1.9 show good liquidity in the short term, but long-term debt of about $714.6M against equity of roughly $132.4M means the capital structure is stretched. That is fine in an uptrend, but it cuts both ways when sentiment turns.
Cash flow data reinforces the mixed picture. The latest quarterly report shows about $247.2M in revenue but a net loss of roughly $20.4M, with operating income also negative. Operating cash flow is positive at around $11.1M and free cash flow is slightly positive, helped by stock-based compensation and working capital moves, while financing inflows are driven by new debt issuance. For traders, TNDM is a classic high-opportunity, high-risk setup: strong sales base, improving cash flow, but heavy leverage and persistent losses.
Conclusion
Tandem Diabetes Care Inc. has just shown traders how quickly sentiment can flip. Weekly price data shows the stock opening near $19.87 and tagging a high above $21 before closing at $20.50, then the next week collapsing toward the mid-$15s. The intraday 5-minute bar confirms this: price opened around $20, briefly pushed to $20.03, then was hit down to about $15.44 before stabilizing near $15.48. That is a violent intraday range, the kind of action that clears both weak longs and shorts.
From a risk/reward view, TNDM now trades at roughly 1.05x sales, with a price-to-book multiple above 6x and negative earnings, all while carrying significant leverage. That combination usually means the market is paying for growth potential and product strength, but it will punish any sign of slowing momentum or rising costs. Traders should respect the downside risk if the mid-teens fail to hold, but also recognize that sharp flushes can set up powerful bounces when selling pressure exhausts.
For educational purposes, the key is to let the chart confirm your bias. Watch how TNDM behaves around recent intraday lows and prior weekly support, and size positions accordingly given the leverage and losses. As Tim Bohen, lead trainer with StocksToTrade says, “The best way to learn is by tracking trades, wins, losses, and lessons learned. Every trade has something to teach.” As I tell my students worldwide, “Your edge is not calling the bottom; your edge is waiting for clean price confirmation, then managing risk so one bad candle never ruins your month.””,”scores”:{“risk-level”:”high”},”trade”:”false
This is stock news, not investment advice. StocksToTrade News delivers real-time stock market updates tailored to highlight the key catalysts driving short-term price movements. Our coverage is designed for active traders and investors who thrive in fast-moving markets, with a focus on volatile sectors like penny stocks, AI stocks, Robinhood stocks and other momentum plays. From earnings reports and FDA approvals to mergers, new contracts, and unusual trading volume, we break down the events that can spark significant price action.
Looking to level up your trading game? Explore StocksToTrade, the ultimate platform for traders. With powerful tools designed for swing and day trading, integrated news scanning, and even social media monitoring, StocksToTrade keeps you one step ahead.
Check out our quick startup guide for new traders!
- How to Read Stock Charts: A Guide for Beginners
- Trading Plan: 6 Steps to Create One
- How To Create a Stock Watchlist
Ready to build your watchlists? Check out these curated lists:
Once your watchlist is set, take the next step and trade with confidence using StocksToTrade’s robust platform. Don’t miss out — grab your 14-day trial for just $7 and experience the edge you need to thrive in today’s fast-paced markets.