
StoneCo Ltd. faces heightened selling pressure after its most negative regulatory and earnings headlines; stocks have been trading down by -38.63 percent.
Click Here for a Millionaire's POV on Trading STNE
SUBSCRIBE FOR ALERTSJOIN 50,000+ ACTIVE TRADERS
Key Takeaways
- Price action in STNE shows a steady grind higher on the daily chart, with recent closes holding above prior lows and signaling dip-buyers are active.
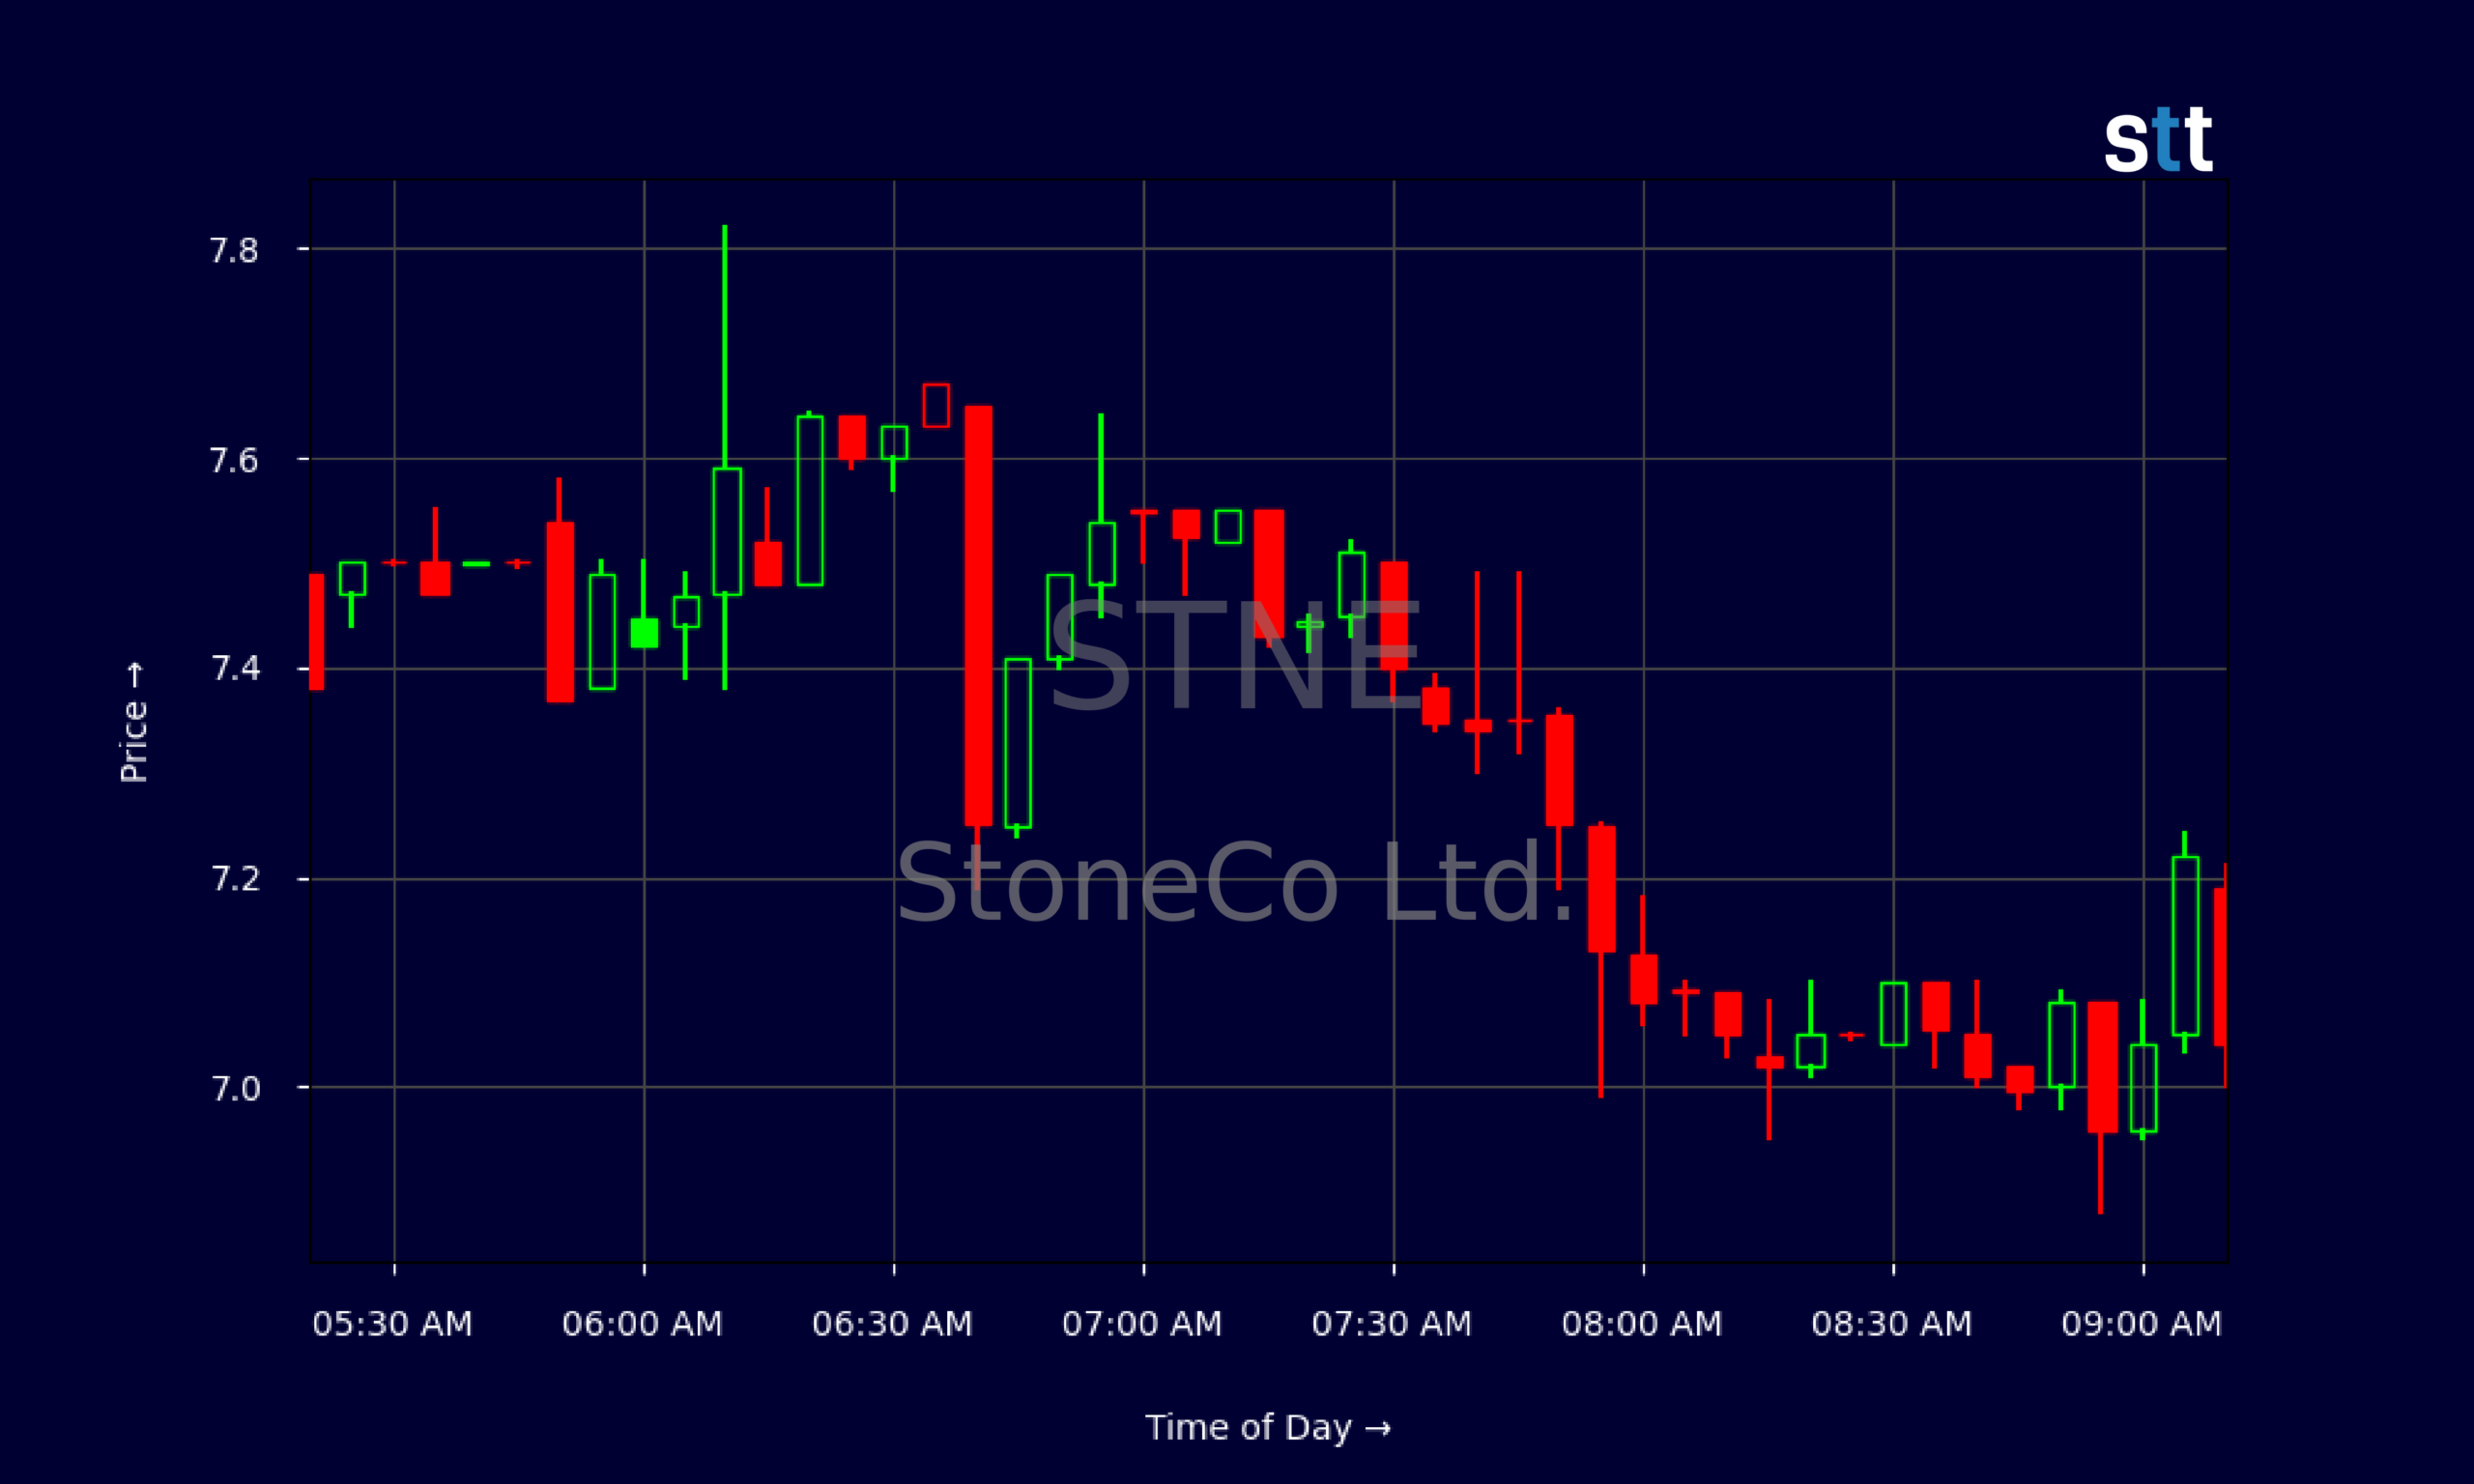
- Intraday STNE trading shows a sharp gap down into the $8s, followed by heavy volatility and a fade into the low $7s, a classic momentum squeeze-and-fade pattern.
- StoneCo Ltd. reports roughly $13.4B in revenue and a negative pretax margin, telling traders the growth story comes with real profitability risks.
- STNE carries about $8.8B in long-term debt but also over $7.8B in cash and short-term investments, giving the company flexibility but keeping leverage on the radar.
- With price-to-sales around 1.17 and price-to-book near 1.43, STNE trades closer to value territory than high-flying growth, a setup active traders often like around clear technical levels.
Live Update At 09:17:50 EDT: On Monday, October 26, 2026 StoneCo Ltd. stock [NASDAQ: STNE] is trending down by -38.63%! Discover the key drivers behind this movement as well as our expert analysis in the detailed breakdown below.
Quick Financial Overview
StoneCo Ltd., trading under ticker STNE, is not acting like a broken story on the numbers alone, but the tape tells a mixed story. On the income side, STNE posts about $13.4B in revenue, yet runs a pretax profit margin near -16%. That means the company is pushing volume but still bleeding before taxes. Traders need to understand that negative margin equals execution risk, no matter how exciting the growth angle sounds.
On the balance sheet, STNE shows around $62.3B in total assets and about $51.3B in total liabilities. Long-term debt sits near $8.8B, while cash and equivalents plus short-term investments are roughly $7.8B. So StoneCo Ltd. is leveraged, but not cornered. Book value per share around 44.57 and a price-to-book ratio near 1.43 suggest STNE trades near what many would call “reasonable” rather than bubble territory.
More Breaking News
- WFRD Rises As Weatherford Beats Earnings And Cleans Up Balance Sheet
- PAGS Stock Slips As Insider Selling Raises Red Flags
- INTR Stock Holds Gains As Price Action Tightens
- XP Stock Grinds Higher As Traders Watch Key Levels
For traders, the key is that STNE combines scale, leverage, and thin or negative profitability. That mix often produces sharp trend moves once sentiment flips, up or down.
Why Traders Are Watching STNE Price Action
STNE’s chart is where things get interesting for short-term trading. On the daily time frame, StoneCo Ltd. has climbed from the mid-$9s to the low-$12s over this recent window. Price walked higher from a close near 9.42 up to 12.46, then drifted in an 11.3–12.3 channel. That stair-step action tells traders that dip-buyers repeatedly stepped in around the $11 zone, while sellers defended the low $12s.
The daily candles show multiple sessions where STNE opened near the prior close, pushed into the $12s, and then closed a bit off the highs. That behavior points to a slow, grinding uptrend with overhead supply still in play. For active trading, those are ideal conditions for breakout-versus-fakeout setups around levels like 11.50, 11.80, and 12.10.
Intraday, STNE is a different animal. Pre-market shows a huge gap from the $9.60 open down into the $8s, then a spike to 8.80–8.80+ before a steady fade. From there, the stock slides through the $8 handle and churns in the mid-$7s most of the morning. That’s textbook volatility compression: early fireworks then a boxed range around 7.00–7.60.
For momentum traders, these swings in STNE are gold — as long as you respect risk. The tape shows StoneCo Ltd. still attracts volume and emotional trading. That keeps it on watch lists for both long breakouts and short pops into resistance.
Conclusion
Right now, STNE sits in that tricky middle ground where the fundamentals are “good enough” to keep the story alive but messy enough to fuel sharp re-ratings. StoneCo Ltd. has real revenue, a sizeable asset base, and a leveraged but workable balance sheet. At the same time, negative pretax margins and a leverageratio near 5.7 remind traders this is not some sleepy, low-risk banking stock.
Technically, StoneCo Ltd. is trying to hold a rising range on the daily, while the intraday tape shows big gaps, fast spikes, and controlled fades. That combination screams “trader’s stock.” You get clear levels, real volatility, and enough liquidity for both long and short strategies. STNE’s price around the low teens on the daily chart, with support zones near $11 and resistance in the low $12s, gives defined battle lines.
For those studying the STNE setup, the playbook is simple: map your levels, size down, and let the chart confirm your bias. As Tim Bohen, lead trainer with StocksToTrade says, “The best way to learn is by tracking trades, wins, losses, and lessons learned. Every trade has something to teach.” That kind of tracking mindset pairs well with a volatile ticker like STNE, where reviewing each entry and exit helps refine future trading decisions. As Tim Sykes loves to hammer home, “The market doesn’t care about your opinion — only your discipline. Cut losses quickly, protect your account, and let the best setups come to you.” STNE fits that mindset perfectly right now — a volatile, data-rich stock for traders who prepare first and trade second.
This is stock news, not investment advice. StocksToTrade News delivers real-time stock market updates tailored to highlight the key catalysts driving short-term price movements. Our coverage is designed for active traders and investors who thrive in fast-moving markets, with a focus on volatile sectors like penny stocks, AI stocks, Robinhood stocks and other momentum plays. From earnings reports and FDA approvals to mergers, new contracts, and unusual trading volume, we break down the events that can spark significant price action.
Looking to level up your trading game? Explore StocksToTrade, the ultimate platform for traders. With powerful tools designed for swing and day trading, integrated news scanning, and even social media monitoring, StocksToTrade keeps you one step ahead.
Check out our quick startup guide for new traders!
- How to Read Stock Charts: A Guide for Beginners
- Trading Plan: 6 Steps to Create One
- How To Create a Stock Watchlist
Ready to build your watchlists? Check out these curated lists:
Once your watchlist is set, take the next step and trade with confidence using StocksToTrade’s robust platform. Don’t miss out — grab your 14-day trial for just $7 and experience the edge you need to thrive in today’s fast-paced markets.