

Medical Properties Trust Inc. stocks have been trading down by -3.56 percent amid heightened concerns over its tenant liquidity and rent recovery.
Key Takeaways
- Shares of Medical Properties Trust Inc. are grinding lower, with MPT dropping from the $3.20s in mid-October 2026 to around $2.18 recently.
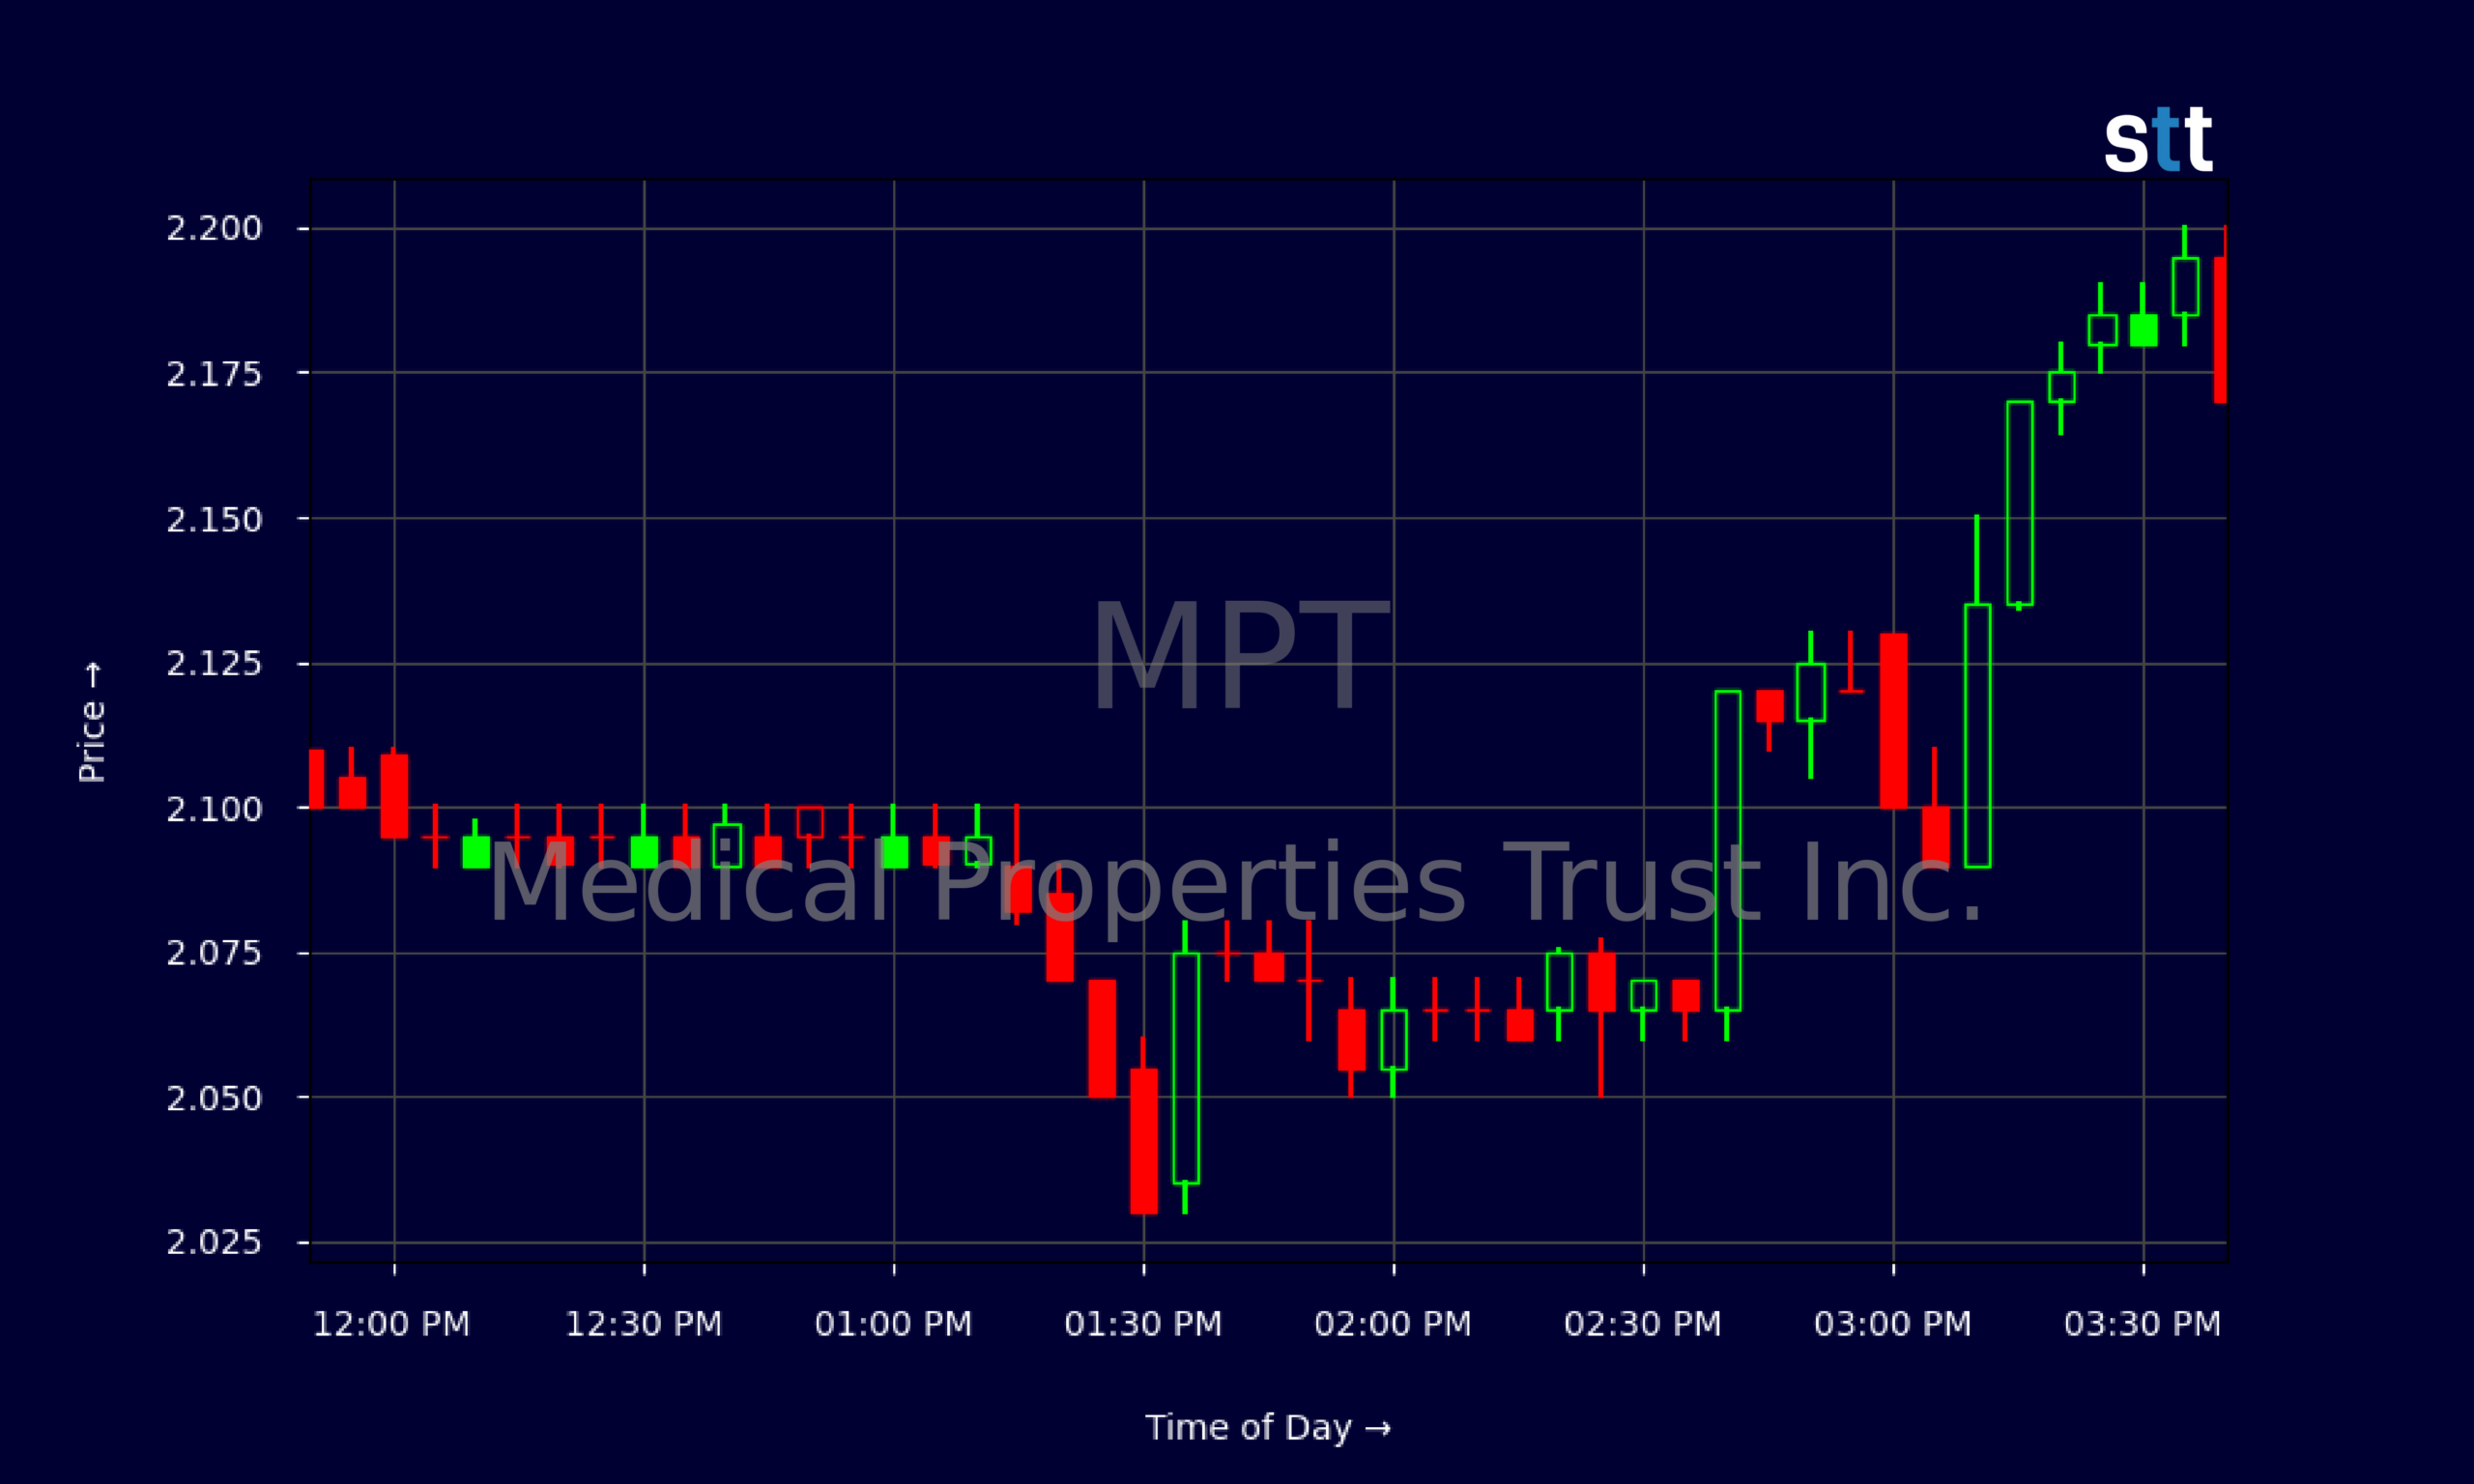
- The intraday tape shows MPT trading in a tight band near $2.10–$2.20, signaling consolidation after heavy recent selling.
- Medical Properties Trust Inc. posts roughly $259M in quarterly revenue and strong EBITDA, but bottom-line net income is slightly negative.
- MPT runs with high leverage, carrying about $9.0B in long-term debt against roughly $4.5B in equity, keeping risk elevated.
- A headline dividend yield near 16% on MPT reflects market skepticism about how long that payout can last.
Live Update At 15:46:26 EST: On Monday, November 02, 2026 Medical Properties Trust Inc. stock [NYSE: MPT] is trending down by -3.56%! Discover the key drivers behind this movement as well as our expert analysis in the detailed breakdown below.
Quick Financial Overview
Medical Properties Trust Inc. sits in classic “battleground REIT” territory. On paper, MPT throws off serious cash. Quarterly revenue lands around $259M, with gross margin over 97% and EBITDA near $230M. That tells traders the core hospital real-estate model still generates strong rent and cash flow.
Drill deeper, and the picture gets tougher. Net income for the latest quarter is slightly negative at about -$2.6M, which pushes earnings per share for MPT to roughly -$0.01. High non‑cash charges, interest costs, and write‑downs are chewing through what looks like a healthy operating base.
On the balance sheet, Medical Properties Trust Inc. carries about $14.7B in assets and about $10.2B in total liabilities. Long-term debt of roughly $9.0B leaves MPT with a debt‑to‑equity ratio above 2, and interest coverage near 1x. That signals very little margin for error if funding costs stay high or tenants stumble.
More Breaking News
- JBLU Stock Rallies As Turnaround Plan Targets 2027 Profit
- VRRM Slides As Multiple Law Firms Probe Corporate Wrongdoing
- Oracle Stock Slides As AI Spending And Data Breach Rattle Traders
- MPT Stock Slides As Traders Focus On Debt And Support Levels
Cash stands close to $397M, and the current ratio around 3.0 shows near‑term liquidity is decent. But for traders, the key question with MPT is simple: will that cash flow be used to pay down debt, or to keep supporting a rich dividend?
Why Traders Are Watching MPT Price Action
On the chart, Medical Properties Trust Inc. looks like it’s still working through a long downtrend. In early October 2026, MPT traded near $3.20–$3.25. Over the following weeks, sellers consistently hit strength: each bounce into the $3.10s and $3.20s rolled over, then the stock cracked the $3.00 area and kept drifting lower.
By late October, MPT was printing closes in the $2.70s and $2.80s. The real breakdown came when MPT failed to hold the $2.50s and then the $2.30s. The latest daily candle shows Medical Properties Trust Inc. opening around $2.25 and closing near $2.18 after a dip to about $2.03. That kind of lower‑low, lower‑high action confirms pressure is still to the downside.
Zoom into the intraday 5‑minute chart and you see the psychology in real time. At the open, MPT tried to push above $2.25 but sellers stepped in fast, knocking it into the low $2.20s and then toward $2.10. For most of the midday session, Medical Properties Trust Inc. churned around $2.09–$2.12 — tight range, light directional follow‑through, volume thinning out.
Late-day, MPT attempted a modest rebound from about $2.09 toward $2.20, but the move stalled under the morning highs. That’s classic consolidation after a trend leg down. Short‑term traders watch these bands closely: a clean break under $2.00 on MPT could trigger another wave of selling, while a reclaim and hold over the $2.30–$2.40 zone would be the first sign the tide is shifting.
REITs tied to healthcare properties are sensitive to rates and tenant health, and the market is clearly demanding a big risk premium from Medical Properties Trust Inc. The roughly 16% indicated yield on MPT looks huge, but in trading that usually means the crowd is betting on a cut or reset down the road.
Conclusion
For active traders, Medical Properties Trust Inc. is a classic high‑risk, high‑headline‑yield setup. The fundamentals tell a mixed story: nearly $1.0B in annualized revenue, fat gross margins, and positive operating cash flow around $62M last quarter. Yet MPT still posts a small net loss, runs with high leverage, and pays out hefty cash dividends — about $0.09 per share for the quarter — against a beaten‑down share price.
That combination explains why MPT trades at a steep discount to its book value of about $7.53 per share and why the price‑to‑sales ratio near 1.8 sits where it does. The market does not trust the current payout or capital structure. Medical Properties Trust Inc. needs time, asset sales, and disciplined debt work to regain confidence.
From a trading standpoint, this is all about levels and risk control. As Tim Bohen, lead trainer with StocksToTrade says, “A good trade setup checks all the boxes—volume, trend, catalyst. Don’t trade if you’re missing pieces of the puzzle.”. The $2.00 area on MPT is a clear psychological line; breaks below can accelerate downside, while reclaiming the mid‑$2s would force shorts to rethink timing. As Tim Sykes has said for years, “Cut losses quickly — that one rule has saved me more than any hot stock pick ever has.” In a name like MPT, with leverage, headline yield, and a weak trend, that rule matters even more.
Traders who track Medical Properties Trust Inc. should keep watching volume, support and resistance zones, and how management handles debt and cash flow. The story is far from over — but the chart will tell the truth long before the glossy presentations do.
This is stock news, not investment advice. StocksToTrade News delivers real-time stock market updates tailored to highlight the key catalysts driving short-term price movements. Our coverage is designed for active traders and investors who thrive in fast-moving markets, with a focus on volatile sectors like penny stocks, AI stocks, Robinhood stocks and other momentum plays. From earnings reports and FDA approvals to mergers, new contracts, and unusual trading volume, we break down the events that can spark significant price action.
Looking to level up your trading game? Explore StocksToTrade, the ultimate platform for traders. With powerful tools designed for swing and day trading, integrated news scanning, and even social media monitoring, StocksToTrade keeps you one step ahead.
Check out our quick startup guide for new traders!
- How to Read Stock Charts: A Guide for Beginners
- Trading Plan: 6 Steps to Create One
- How To Create a Stock Watchlist
Ready to build your watchlists? Check out these curated lists:
Once your watchlist is set, take the next step and trade with confidence using StocksToTrade’s robust platform. Don’t miss out — grab your 14-day trial for just $7 and experience the edge you need to thrive in today’s fast-paced markets.