

Starfighters Space Inc. stocks have been trading up by 48.16 percent following breakthrough launch contract news boosting investor optimism.
Market Insights For Active Traders
- Engaging Integrated Launch Solutions and senior Blue Origin talent sharpens the STARLAUNCH air-launch execution story around U.S. hypersonic and missile-defense test bottlenecks.
- An MOU with Mu-G Technologies to support a modified Falcon 50 in Midland ties Starfighters Space Inc. into NASA’s RFI on restoring U.S. commercial microgravity flight services.
- The Mach 2+ F-104 fleet is being marketed as a “wind tunnel in the sky,” with a second Midland base targeting the hypersonic and commercial launch test gap.
- Collaboration with Blackstar Orbital on SpaceDrone testing and progress toward STARLAUNCH 1 critical design review deepen FJET’s role in hypersonic and air-launch testing.
- Several bullish pieces on Starfighters Space Inc. are paid promotions, so traders should separate marketing from verifiable milestones like contracts and test campaigns.
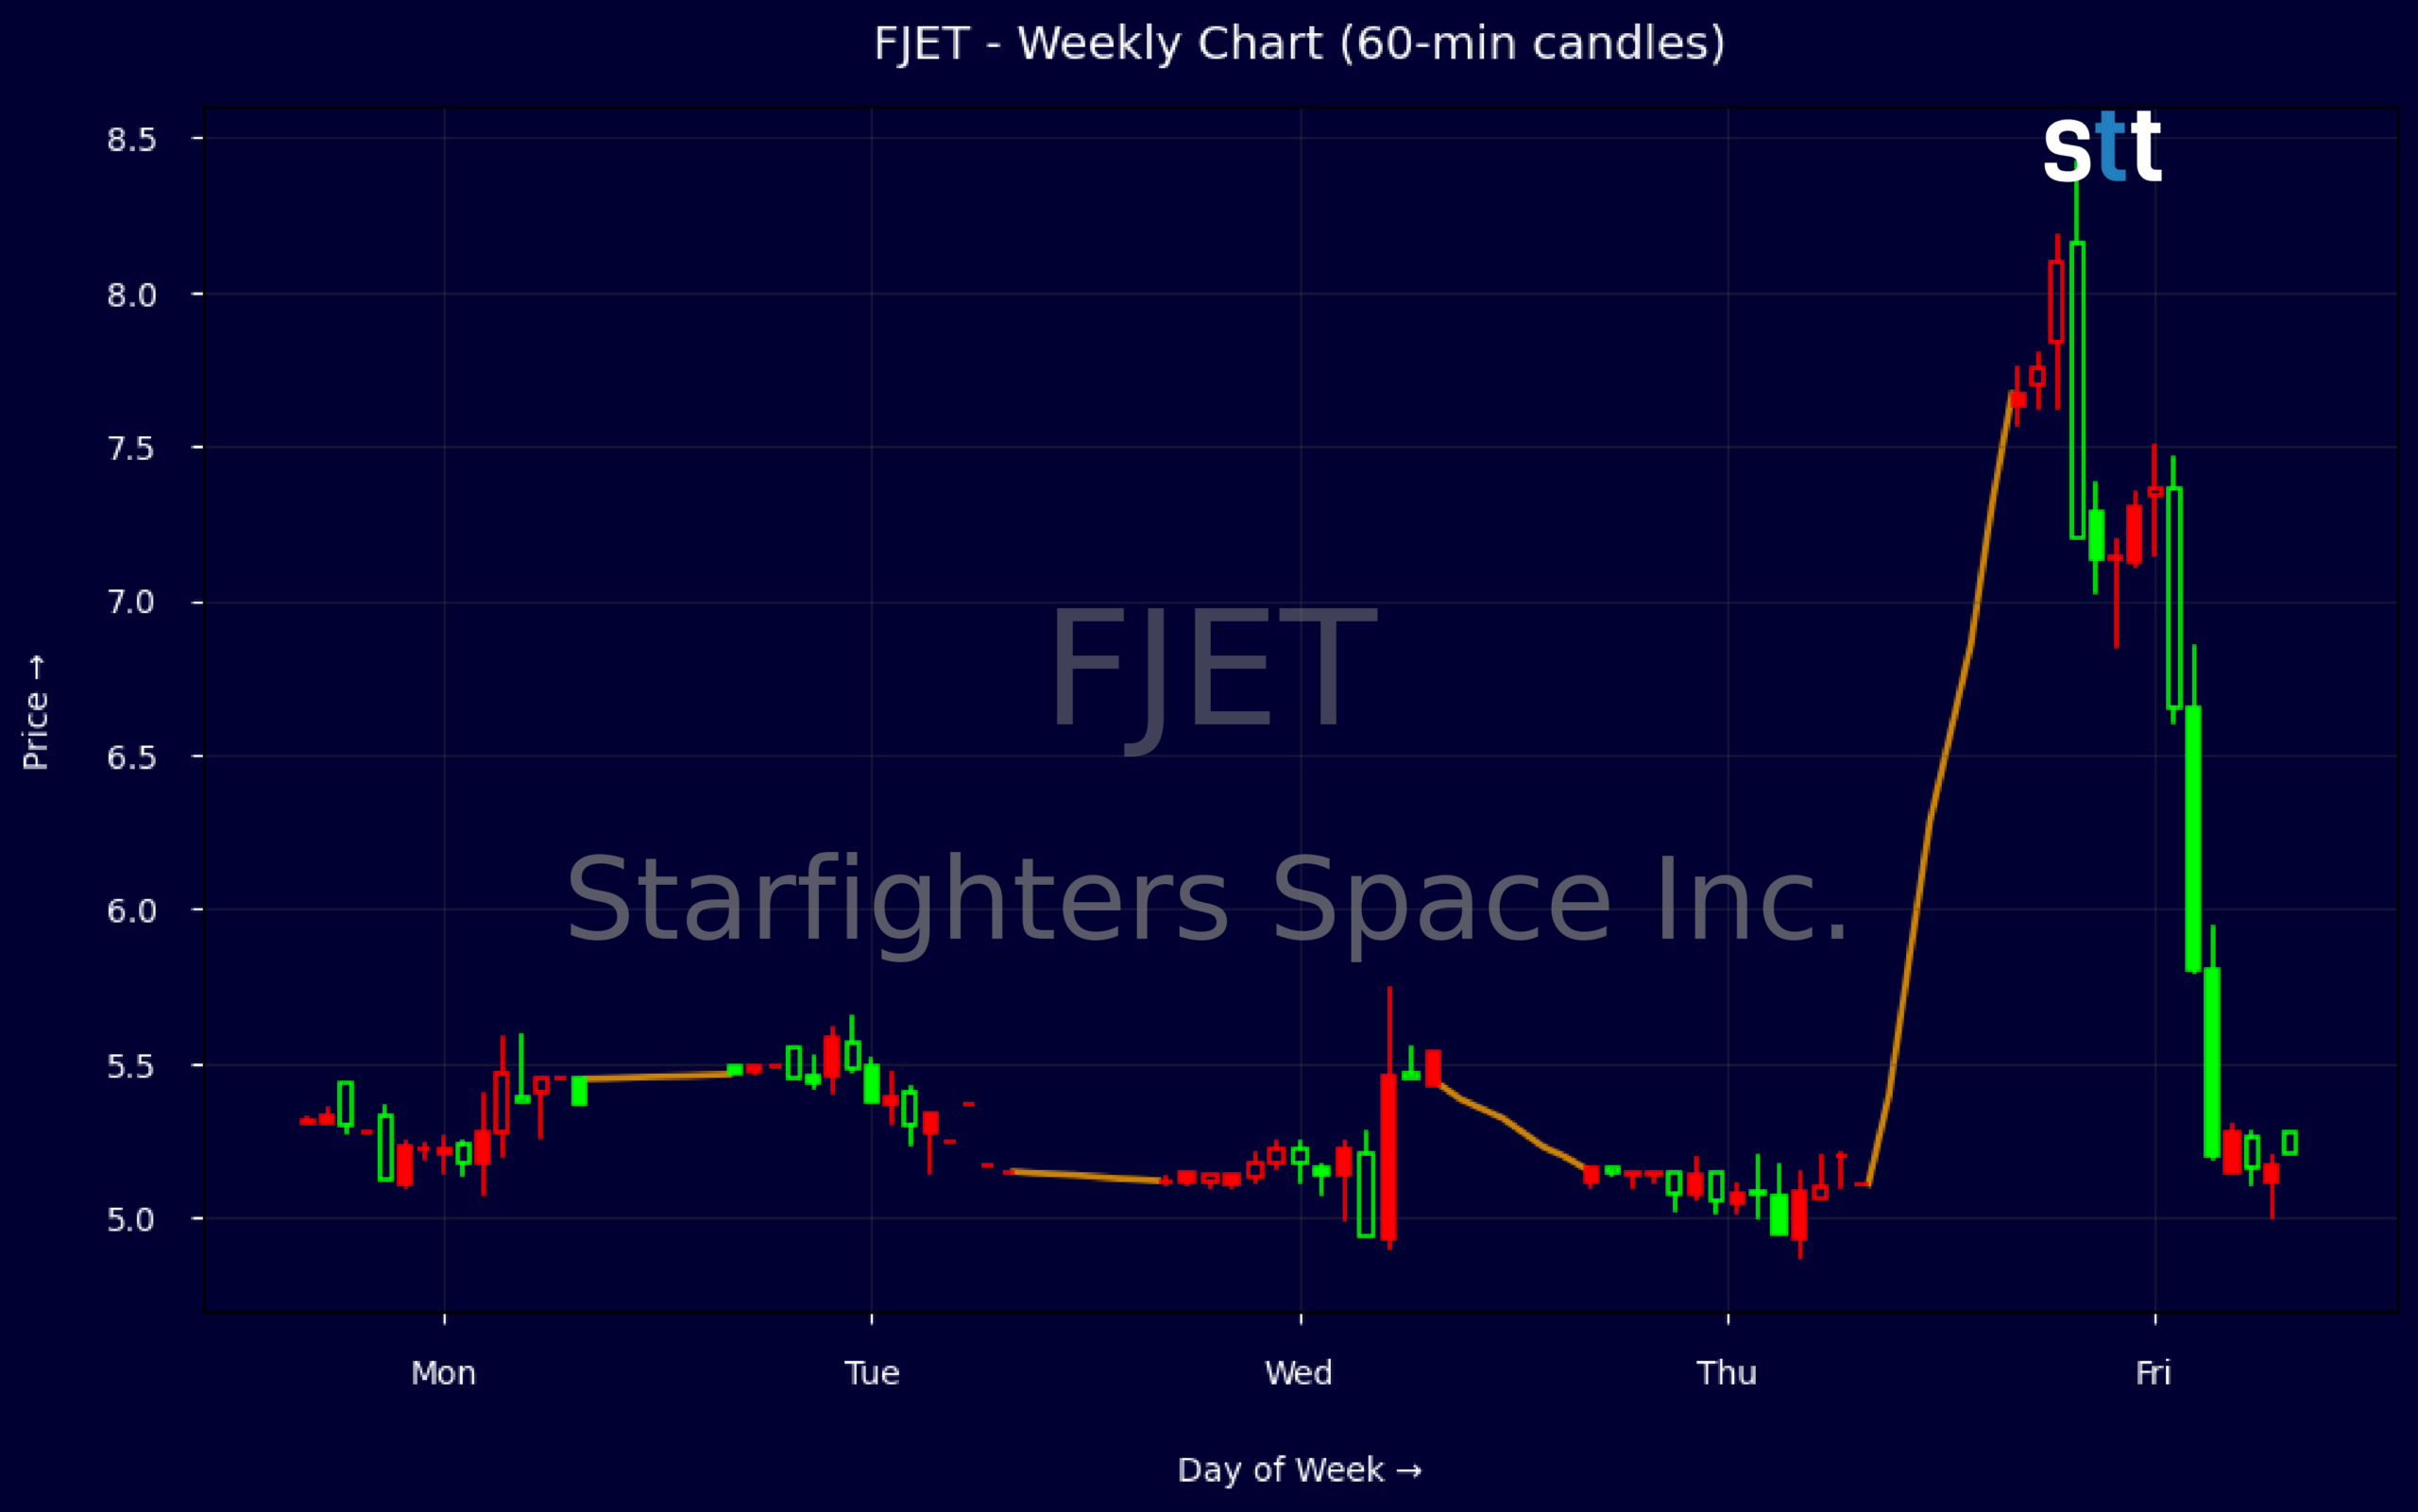
Weekly Update May 18 – May 22, 2026: On Sunday, May 24, 2026 Starfighters Space Inc. stock [NYSE American: FJET] is trending up by 48.16%! Discover the key drivers behind this movement as well as our expert analysis in the detailed breakdown below.
Industrials industry expert:
Analyst sentiment – neutral
Starfighters Space (FJET) is an early‑stage, pre‑scale aerospace test and launch platform with weak fundamentals and a promotional equity profile. Q1‑26 shows negative operating income of ~$3.3m and net loss of ~$4.3m (EPS –$0.10), with operating cash flow –$4.0m and free cash flow –$4.0m, implying high cash burn versus only ~$1.4m cash on balance sheet. Return on assets of –11.4% and ROE of –13.0% underscore value destruction, yet the stock trades at ~9.1x book, discounting flawless execution.
Technically, FJET has transitioned from a tight consolidation around $5.10–5.50 into an aggressive breakout, closing at $7.63 on 5/22 after a gap from $5.15 and wide intraday range up to $8.42, almost certainly on surging volume. The dominant trend is now short‑term bullish but extremely volatile and news‑driven. Key actionable level is $6.80–7.00: above it, momentum traders can lean long with tight risk controls; a decisive break below signals failed breakout and likely mean reversion toward $5.20.
More Breaking News
- AMZN Stock Under Pressure As Rivals Target Core Businesses
- NOK Stock Slides As Earnings Strength Fails To Impress Traders
- GoDaddy Stock Jumps As Q3 Beat And AI Airo Fuel Bullish Outlook
- GPN Stock Jumps As Wall Street Ups Price Targets
Fundamentally, news flow is strong but execution risk is extreme. MOUs with Mu‑G Technologies, expanded Midland operations, “wind tunnel in the sky” positioning, and senior Blue Origin hires address genuine hypersonic and microgravity bottlenecks, but most coverage is promotional. Relative to Industrials and Aerospace & Defense, FJET is earlier‑stage, far less diversified, and materially riskier. I view the stock as speculation, not investment: upside only for high‑risk capital, with near‑term support ~$6.80 and resistance $8.50–9.00.
Quick Financial Overview
The weekly chart for FJET shows a quiet base early in the period, with closes clustering near $5.10–$5.50, followed by a sharp expansion to a $7.20 open and $8.42 high before settling around $7.63. That jump signals a clean momentum break, likely tied to the string of hypersonic and microgravity headlines around late 2026/05. For short-term traders, the $7.20 area now acts as an initial support pivot, while the $8.40 zone is the obvious resistance level where early momentum cooled.
Intraday, a single 5‑minute candle moving from about $5.23 to a $7.50 high and closing near $7.20 highlights just how thin and explosive Starfighters Space Inc. can be. That type of one-bar range expansion tells you liquidity is limited and slippage risk is high. For day traders, this is a name where position size and hard stops matter more than usual; the tape can move too fast to manage with loose risk.
On the fundamentals, FJET is still in build-out mode. The latest quarterly data show about $26.3M in total assets, $22.4M in equity, but a net loss of roughly $4.27M and operating cash flow around -$3.96M. A price-to-book near 9.14 and negative returns on assets and equity confirm this trades like a speculative growth platform, not a cash cow. Free cash flow is deeply negative, and the company relies on its balance sheet and capital access to fund expansion.
Conclusion
This is stock news, not investment advice. StocksToTrade News delivers real-time stock market updates tailored to highlight the key catalysts driving short-term price movements. Our coverage is designed for active traders and investors who thrive in fast-moving markets, with a focus on volatile sectors like penny stocks, AI stocks, Robinhood stocks and other momentum plays. From earnings reports and FDA approvals to mergers, new contracts, and unusual trading volume, we break down the events that can spark significant price action.
Looking to level up your trading game? Explore StocksToTrade, the ultimate platform for traders. With powerful tools designed for swing and day trading, integrated news scanning, and even social media monitoring, StocksToTrade keeps you one step ahead.
Check out our quick startup guide for new traders!
- How to Read Stock Charts: A Guide for Beginners
- Trading Plan: 6 Steps to Create One
- How To Create a Stock Watchlist
Ready to build your watchlists? Check out these curated lists:
Once your watchlist is set, take the next step and trade with confidence using StocksToTrade’s robust platform. Don’t miss out — grab your 14-day trial for just $7 and experience the edge you need to thrive in today’s fast-paced markets.