
SoFi Technologies Inc. stocks have been trading down by -3.45 percent after bearish analyst downgrades raised profitability concerns.
Click Here for a Millionaire's POV on Trading SOFI
SUBSCRIBE FOR ALERTSJOIN 50,000+ ACTIVE TRADERS
Key Takeaways
- Keefe Bruyette Woods cut its SoFi Technologies price target to $15 from $16 and reiterated an Underperform rating.
- The firm cited fair value accounting dynamics, rising interest rates, and rapid balance sheet growth as creating an estimated >$1B headwind in Q3.
- Keefe Bruyette Woods expects these factors to drive elevated loan growth but reduced capital levels for SoFi.
- An insider or large holder filed a Form 144 indicating an intention to sell restricted or control securities of SoFi Technologies under SEC Rule 144.
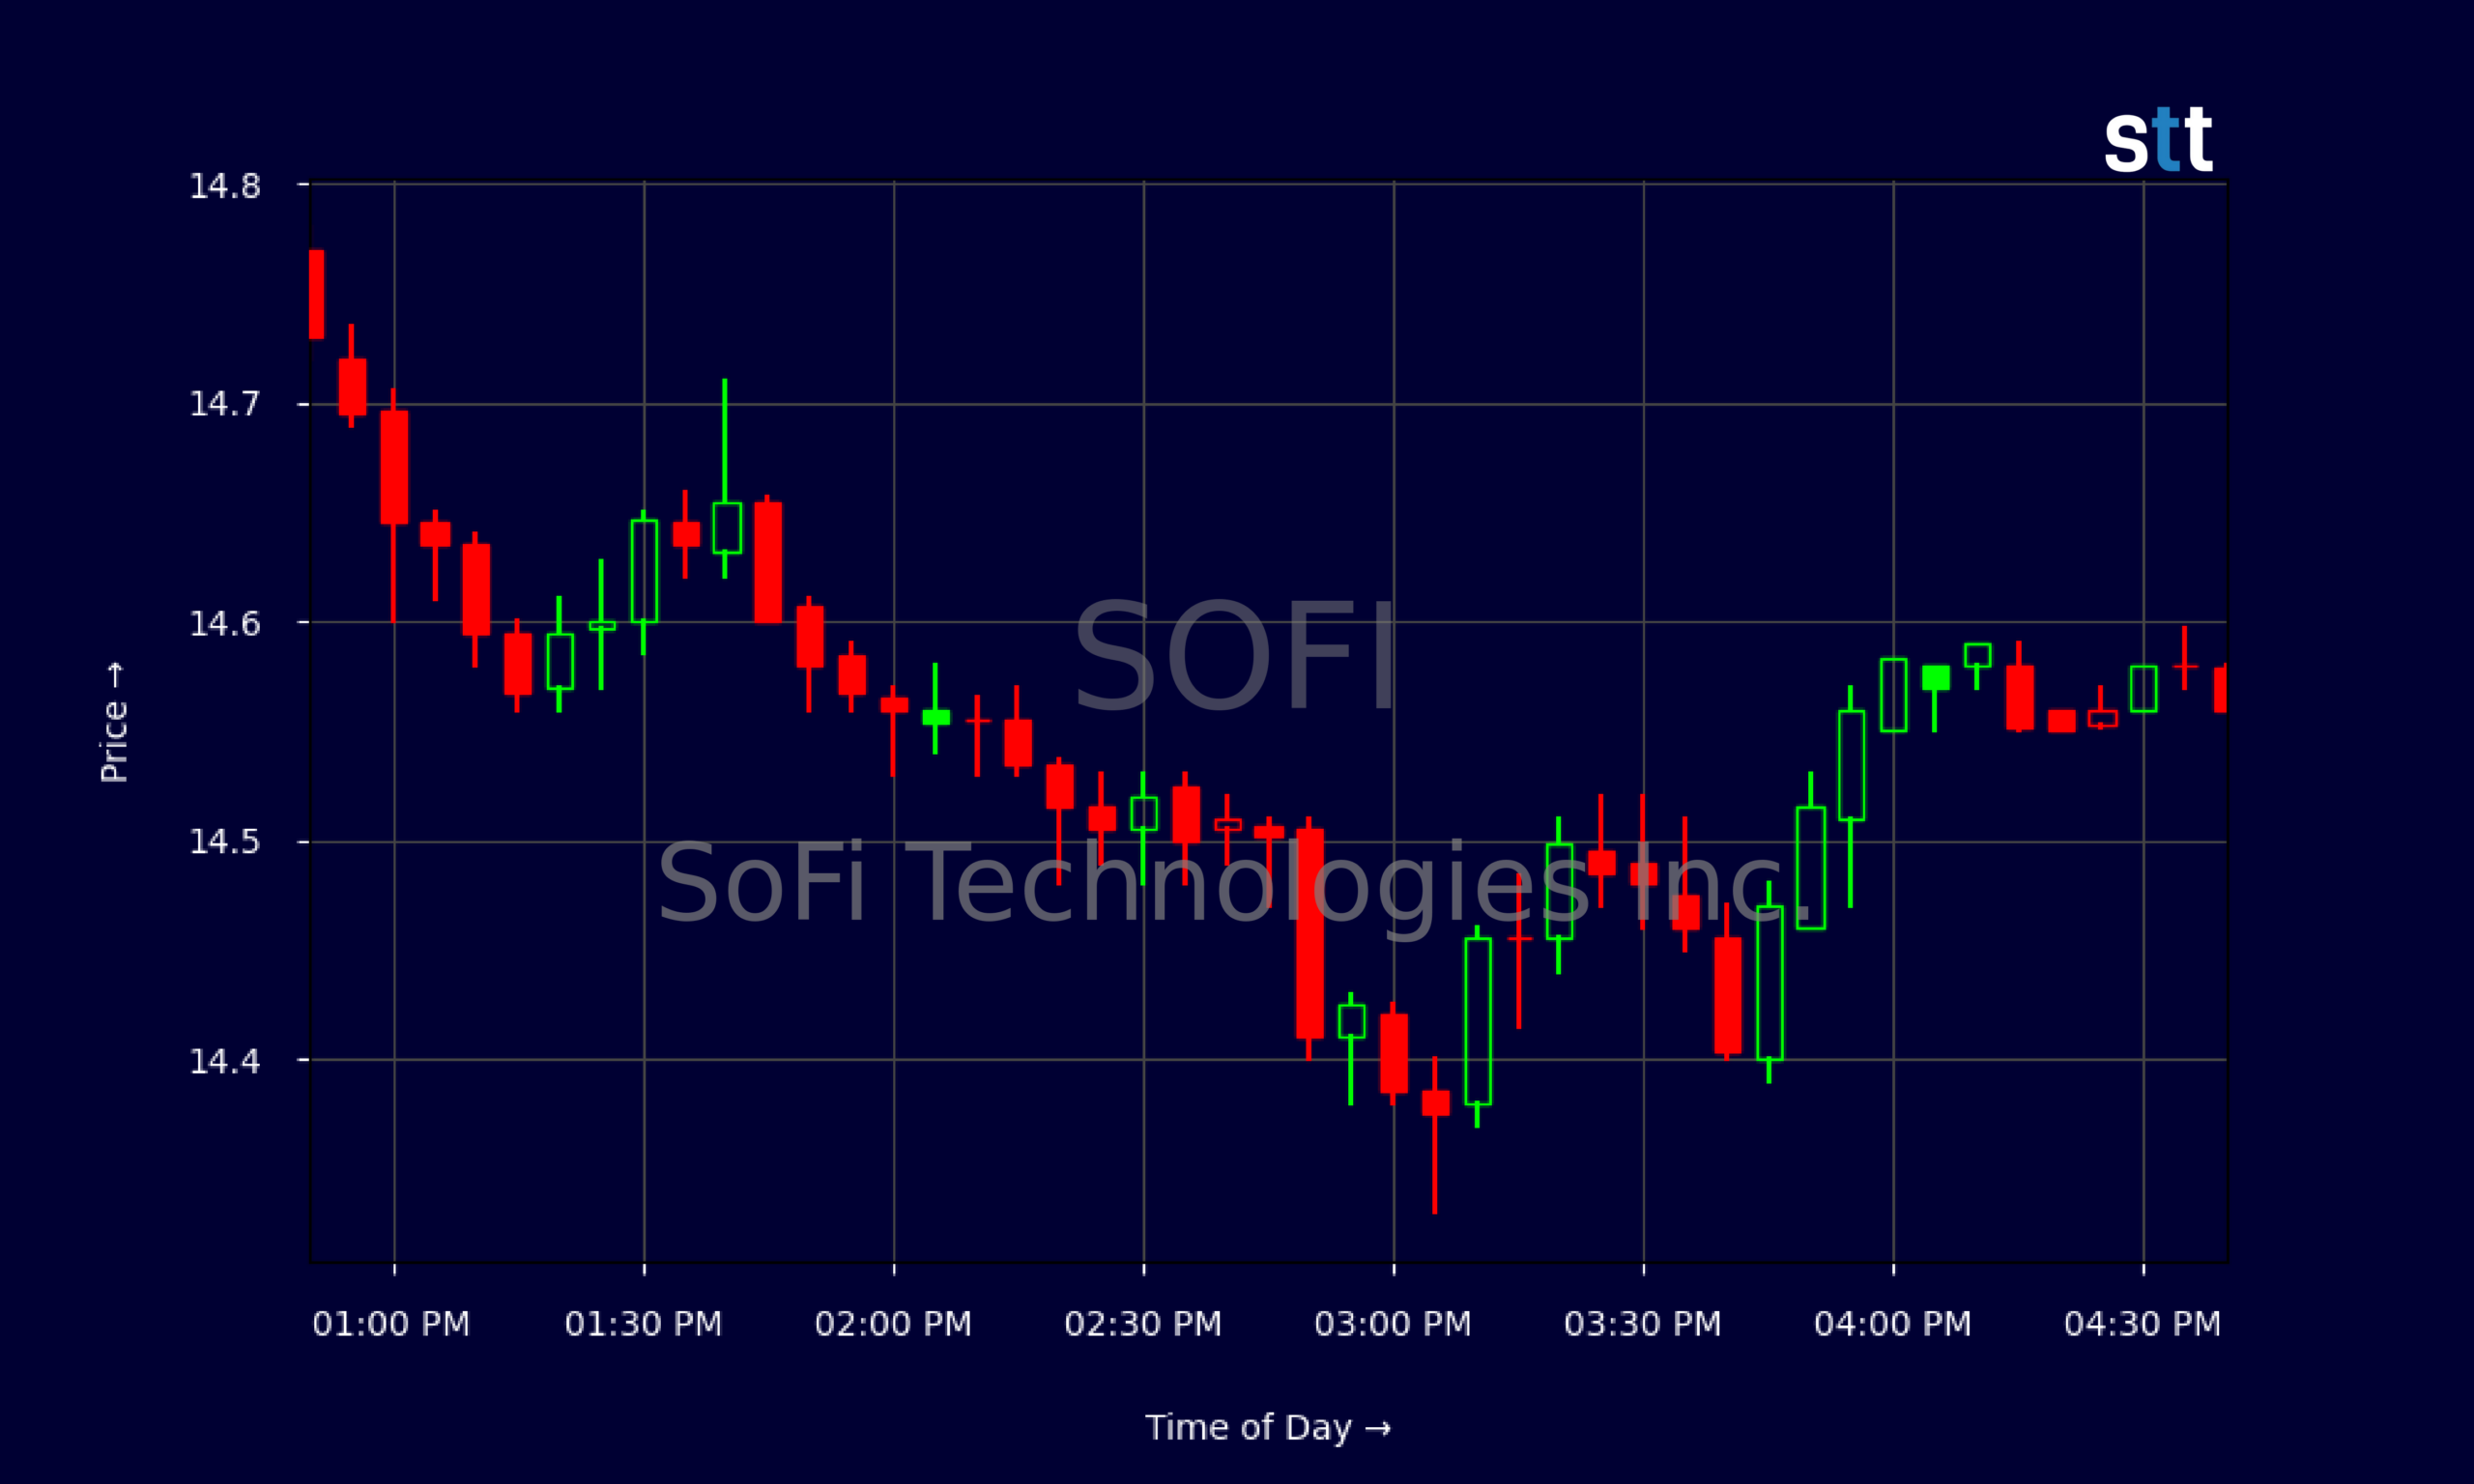
Live Update At 16:46:58 EDT: On Friday, October 16, 2026 SoFi Technologies Inc. stock [NASDAQ: SOFI] is trending down by -3.45%! Discover the key drivers behind this movement as well as our expert analysis in the detailed breakdown below.
Quick Financial Overview
SOFI has been drifting lower in October. The stock closed near $17 in late September and now trades around $14.55 after a red day where it failed to hold an early push above $15.50. That’s a steady series of lower highs and lower closes on the daily chart, a pattern short‑biased traders watch closely.
Intraday, SOFI showed weak bounces. The stock opened near $15.06 and briefly spiked toward $15.54, then faded all day and closed near the lows, with late‑day trading stuck in the mid‑$14s. That intraday trend tells traders that sellers were in control from the open.
More Breaking News
- FMX Rises As FEMSA Locks In Cheap Swiss Debt
- NBIS Stock Slides As Bearish Momentum And AI Doubts Mount
- FMX Edges Higher As FEMSA Locks In Cheap Swiss Debt
- TRGP Jumps As Targa Resources Price Targets Surge Before Q3
Fundamentally, SoFi Technologies is still a high‑growth fintech bank. The latest quarterly report shows revenue of about $3.61B annualized, growing over 30% per year, with a profit margin near 14.8% and a P/E around 32. SOFI generates meaningful net income, but its cash flow from operations ran about -$3.89B in the recent quarter and free cash flow near -$3.99B, a red flag for any trader tracking balance sheet risk and dilution potential.
Why Traders Are Watching SOFI Right Now
The main shock for SOFI this week is the call from Keefe Bruyette Woods. The firm cut its SoFi Technologies price target to $15 from $16 and kept an Underperform rating. When a specialist banking analyst trims a target while already sitting on a bearish stance, momentum traders pay attention. It signals not just caution, but rising conviction that near‑term upside may be capped.
Keefe Bruyette spelled out the problem: more than a $1B headwind in Q3 tied to fair value accounting dynamics, rising interest rates, and rapid balance sheet growth. On the surface, SOFI’s loan book expansion can look like strong growth. But the note warns that this same loan growth may pressure capital levels and expose the company to mark‑to‑market and rate‑driven hits. For traders, that means the headline numbers might look fine while the quality of those numbers quietly erodes.
SOFI’s financials back up why the Street is nervous. The company holds about $60.95B in assets, with roughly $47.93B in net loans and $45.54B in deposits. Leverage is real. Total debt to equity sits near 0.31, and the leverage ratio at 5.5 reminds traders this is a bank‑like balance sheet, not a light‑asset software play. With free cash flow deeply negative and deposits still climbing, any macro jolt in rates or credit could quickly shift sentiment.
Layer on the Form 144 filing from an insider or large holder, signaling planned selling of restricted or control stock under SEC Rule 144, and you have a clean recipe for near‑term pressure. These filings do not guarantee immediate selling, but when SOFI is already sliding and an analyst is cutting its target, traders usually assume more supply could hit the market on any bounce.
Conclusion
SOFI sits at a classic inflection point that experienced traders recognize. On one side, SoFi Technologies is delivering strong revenue growth, positive earnings, and improving returns on equity around 7.1%. On the other, cash flow is negative, leverage is high, and now a key analyst is flagging a >$1B quarterly headwind driven by accounting, rates, and the rapid expansion of the balance sheet. That’s not noise.
With the price target now at $15 and an Underperform rating pinned on SOFI, many longer‑term market participants may step back, while short‑term traders look for reactive trades around support and resistance. Add the insider Form 144 to sell SoFi Technologies shares, and the message to active traders is simple: confidence in near‑term upside is being questioned right as the stock breaks down from the high‑teens zone.
For SOFI, the game now becomes how it manages capital and proves that loan growth is adding real value, not just pumping up assets. Until the numbers show cleaner cash flow and less reliance on fair value gains, sharp moves in either direction are on the table. As Tim Sykes likes to remind his community, “The market doesn’t care about your opinion, only about supply, demand, and the chart in front of you.” In the same spirit of disciplined trading, As Tim Bohen, lead trainer with StocksToTrade says, “A good trade setup checks all the boxes—volume, trend, catalyst. Don’t trade if you’re missing pieces of the puzzle.”. Traders watching SoFi Technologies need to treat this as a teaching moment—study the news, track the levels, and always have a risk plan.
This article is for educational and research purposes only and is not investment advice.
This is stock news, not investment advice. StocksToTrade News delivers real-time stock market updates tailored to highlight the key catalysts driving short-term price movements. Our coverage is designed for active traders and investors who thrive in fast-moving markets, with a focus on volatile sectors like penny stocks, AI stocks, Robinhood stocks and other momentum plays. From earnings reports and FDA approvals to mergers, new contracts, and unusual trading volume, we break down the events that can spark significant price action.
Looking to level up your trading game? Explore StocksToTrade, the ultimate platform for traders. With powerful tools designed for swing and day trading, integrated news scanning, and even social media monitoring, StocksToTrade keeps you one step ahead.
Check out our quick startup guide for new traders!
- How to Read Stock Charts: A Guide for Beginners
- Trading Plan: 6 Steps to Create One
- How To Create a Stock Watchlist
Ready to build your watchlists? Check out these curated lists:
Once your watchlist is set, take the next step and trade with confidence using StocksToTrade’s robust platform. Don’t miss out — grab your 14-day trial for just $7 and experience the edge you need to thrive in today’s fast-paced markets.