

NRX Pharmaceuticals Inc. faces heightened pressure as critical clinical trial delays emerge, while stocks have been trading down by -16.92 percent.
What Traders Need To Know
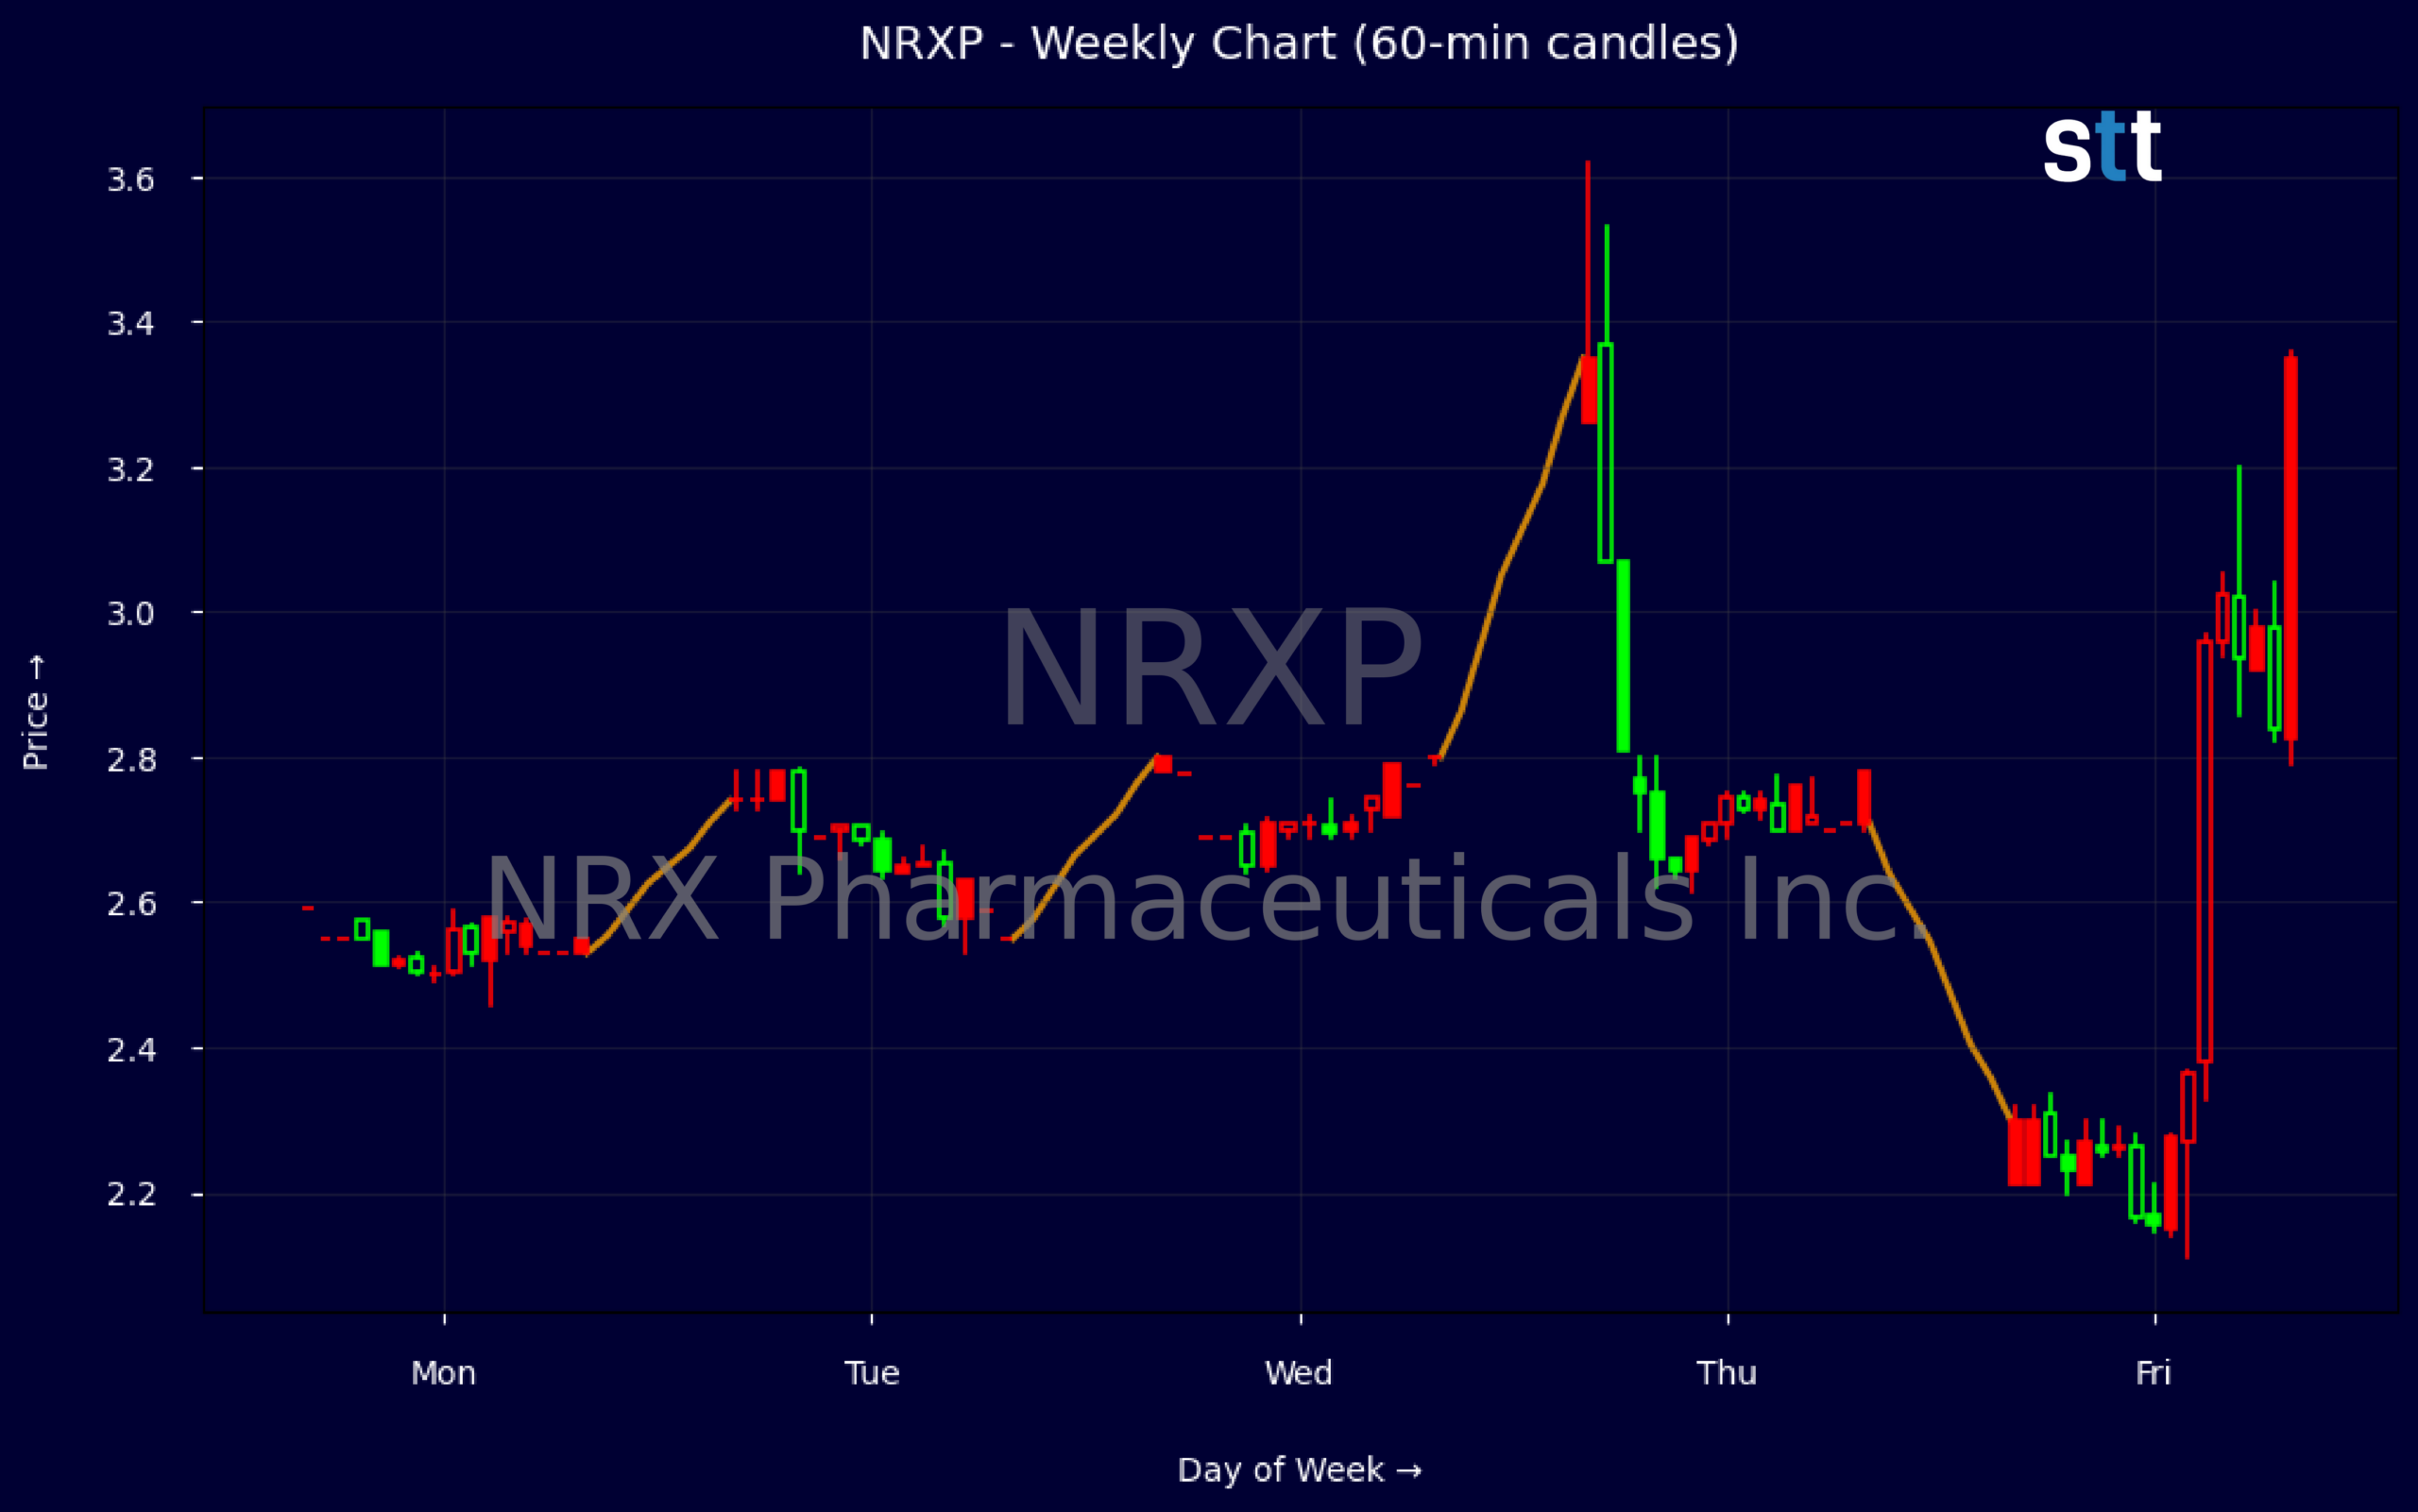
- Weekly chart shows NRXP swinging between $2.21 and $3.62, with the latest close near the lower end, signaling pressure after a failed push above $3.
- Intraday action with a drop from about $2.83 to $2.27 in a single 5‑minute bar highlights thin liquidity and fast downside risk for NRX Pharmaceuticals Inc.
- Financials show about $1.1M in quarterly revenue against a roughly $16.5M net loss, underscoring a high-burn, early-stage profile.
- Balance sheet holds about $26.7M in cash, but negative equity and weak working capital stress the need for ongoing funding.
- Valuation ratios, including a price-to-sales near 36, point to rich expectations despite heavy losses, making timing and risk control crucial for traders.
Weekly Update Oct 26 – Oct 30, 2026: On Sunday, November 01, 2026 NRX Pharmaceuticals Inc. stock [NASDAQ: NRXP] is trending down by -16.92%! Discover the key drivers behind this movement as well as our expert analysis in the detailed breakdown below.
Healthcare industry expert:
Analyst sentiment – negative
NRx Pharmaceuticals (NRXP) is an ultra‑high‑risk micro‑cap with a deeply impaired equity base and pre-commercial fundamentals. Revenue is immaterial at ~$1.1M with gross margin of 46.6%, overwhelmed by extreme negative EBIT margin (~‑700%) and net margin (~‑692%). ROA below ‑120% and negative equity underscore accumulated losses (~$325M retained deficit). Cash of ~$26.7M versus current liabilities of ~$33.9M (current ratio 0.9) and negative working capital highlight meaningful balance-sheet strain despite recent financing inflows.
Technically, the weekly tape shows extreme volatility and a failed breakout: price spiked from the 2.70 area to a 3.62 high before reversing sharply to a 2.21 close, leaving a long weekly upper wick and signaling aggressive distribution near 3.25–3.60. The dominant short-term trend is now corrective/lower from that blowoff. With thin liquidity and likely surging volume on the reversal day, $2.20–2.25 becomes a critical support pivot; a decisive break invites momentum shorts targeting sub‑$2.
More Breaking News
- CareDx CDNA Rips Higher After Big Earnings Beat And Guidance Hike
- Rocket Companies RKT Stock Dips As Q3 Earnings Smash Estimates
- Pinterest Stock Slips As Revenue Misses Rattle Traders
- Global Payments Stock Climbs As Analysts Bet On Worldpay Upside
With no material news flow and no near-term commercial validation, NRXP trades primarily as a financing-dependent biotech story, meaning its risk profile is far worse than diversified Healthcare or Biotechnology & Life Sciences benchmarks that possess revenues and capital access. I assign a negative outlook: upside is capped by firm resistance at $3.25–3.60, while sustainable support only emerges near $2.00. Risk‑tolerant traders can fade rallies into $3.00–3.25 with tight risk control; long‑only investors should avoid.
Quick Financial Overview
NRX Pharmaceuticals Inc. sits in classic high-risk, high-reward territory. Revenue for the recent quarter is roughly $1.1M, but the company booked a net loss of about $16.5M and EBITDA around -$16.1M. That combination produces extreme negative margins and explains why key profitability ratios like EBIT margin and profit margin show deep red numbers. For traders, this means the story is not about current earnings strength. It is about whether the company can keep funding operations long enough to potentially unlock future value.
The balance sheet shows total assets near $34.2M and cash around $26.7M, but equity is slightly negative at about -$0.2M. Current liabilities of roughly $33.9M versus current assets near $29.2M translate to a current ratio of 0.9, a sign of tight near-term liquidity. Working capital is negative, so NRX Pharmaceuticals Inc. remains dependent on capital markets. At the same time, cash flows show about $29.5M from financing activities in the quarter, which boosted cash by almost $20M. Traders should assume dilution risk is part of the setup.
On valuation, an enterprise value near $111.4M against about $1.2M in trailing revenue drives a price-to-sales ratio around 36. That is rich for a company with such steep losses and negative returns on assets. The stock’s weekly chart shows a recent high near $3.62 followed by a slide to about $2.21, confirming that buyers backed off quickly at higher levels. Intraday, a single 5‑minute candle from roughly $2.83 down to $2.27 signals how quickly bids can vanish. For short-term traders, NRXP is a pure momentum and liquidity play, not a value name.
Conclusion
This is stock news, not investment advice. StocksToTrade News delivers real-time stock market updates tailored to highlight the key catalysts driving short-term price movements. Our coverage is designed for active traders and investors who thrive in fast-moving markets, with a focus on volatile sectors like penny stocks, AI stocks, Robinhood stocks and other momentum plays. From earnings reports and FDA approvals to mergers, new contracts, and unusual trading volume, we break down the events that can spark significant price action.
Looking to level up your trading game? Explore StocksToTrade, the ultimate platform for traders. With powerful tools designed for swing and day trading, integrated news scanning, and even social media monitoring, StocksToTrade keeps you one step ahead.
Check out our quick startup guide for new traders!
- How to Read Stock Charts: A Guide for Beginners
- Trading Plan: 6 Steps to Create One
- How To Create a Stock Watchlist
Ready to build your watchlists? Check out these curated lists:
Once your watchlist is set, take the next step and trade with confidence using StocksToTrade’s robust platform. Don’t miss out — grab your 14-day trial for just $7 and experience the edge you need to thrive in today’s fast-paced markets.