

SailPoint Inc. stocks have been trading down by -7.41 percent following bearish sentiment over slowing identity-security contract growth.
What Traders Need To Know
- Weekly action in SailPoint Inc. (SAIL) shows a steady slide from above $16 toward the high-$13 area, signaling pressure after a short consolidation.
- Intraday, the wide 5-minute range from roughly $15.40 down to the high-$13s signals aggressive selling and elevated volatility.
- Revenue near $1.07B and a strong 66.4% gross margin show SAIL has scale, but negative profit margins highlight an unprofitable growth profile.
- A solid cash position, positive free cash flow, and low debt give SailPoint Inc. room to keep funding growth despite current losses.
- Traders are weighing rich sales and cash flow multiples against ongoing net losses and weak recent price momentum.
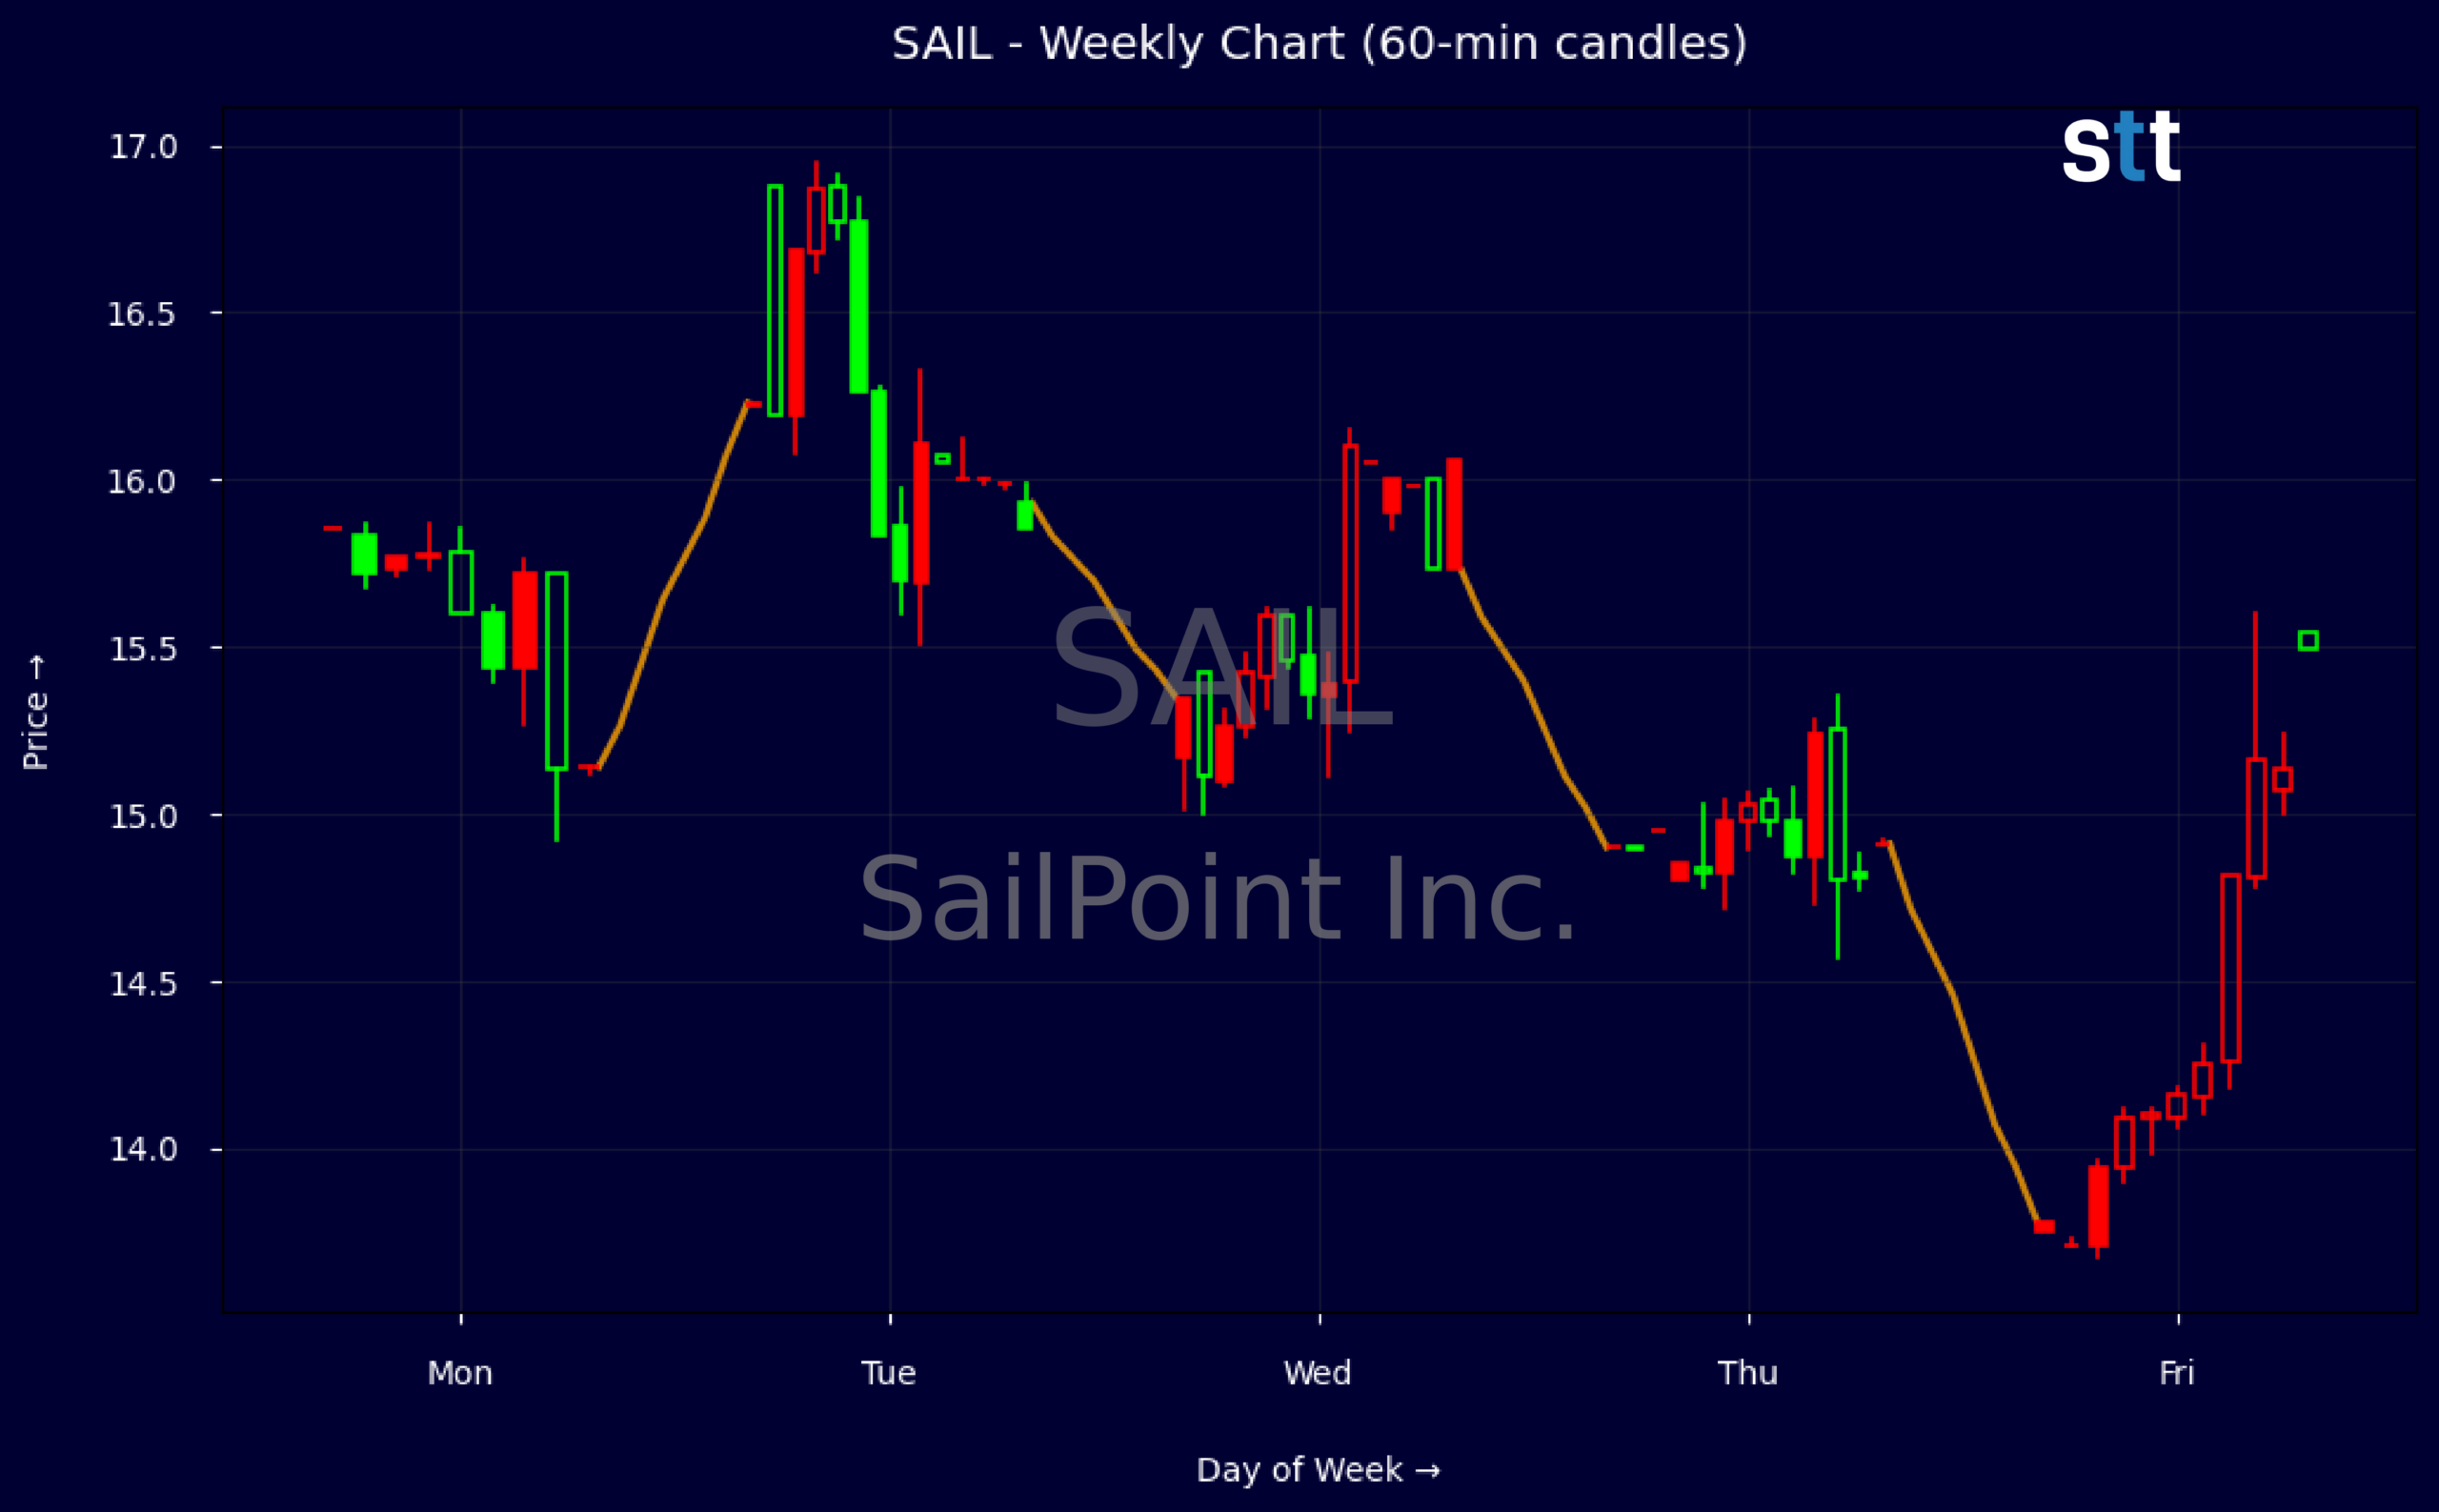
Weekly Update Jul 06 – Jul 10, 2026: On Sunday, July 12, 2026 SailPoint Inc. stock [NASDAQ: SAIL] is trending down by -7.41%! Discover the key drivers behind this movement as well as our expert analysis in the detailed breakdown below.
Technology industry expert:
Analyst sentiment – negative
SailPoint (SAIL) remains a top-tier enterprise identity security platform with strong strategic positioning but weak earnings power. Revenue of ~$1.07B and 66% gross margin confirm a solid subscription/SaaS mix, yet EBIT margin (-17.8%) and pretax margin (-30.4%) show the model is still subscale and sales-heavy. Returns are negative (ROA -4.6%, ROIC -3.7%), and profitability is reliant on high stock-based compensation. Balance sheet is clean (no debt, current ratio 1.4), and EV/Sales of ~5.8x and P/B ~0.95 imply the market is pricing in mid-teens growth with eventual margin normalization but little room for operational missteps.
Technically, SAIL is in a short-term downtrend. Over the recent week, price slid from ~16.9 intraday high to a 13.75 close, with progressively lower highs and lows, confirming persistent supply. Intraday 5‑minute candles show failed bounces and consistent selling into strength, suggesting institutions are distributing rather than accumulating. Key actionable level: 15.20–15.30, where prior support broke and now acts as resistance. As long as price remains below this band on closing basis, risk skews to the downside; a decisive reclaim with volume would signal a tradable reversal.
More Breaking News
- AAL Stock Slides As Fuel Shock Slams 2026 Outlook
- IOVA Stock Collapses As Traders Flee Biotech High‑Flier
- FDXF Stock Climbs As Momentum Traders Target Freight Play
- CMCSA Stock Grinds Higher As Earnings Beat Meets Big Restructure
With no meaningful near-term news catalysts, performance will track sector risk appetite and execution versus peers in Software & IT Services. Versus large-cap software, SAIL trades cheaper on sales but with inferior profitability and similar stock-based comp intensity, justifying a valuation discount. Baseline outlook is constrained: upside capped by heavy resistance around 15.20–15.50, stronger resistance near 16.50; initial support sits at 13.50, with risk toward 12.50 on further de-risking. Verdict: avoid as a core holding; only consider as a tactical trade above 15.30 with tight risk controls.
Quick Financial Overview
SailPoint Inc. (SAIL) is showing a clear near-term downtrend on the weekly chart. Price moved from the mid-$15s to the low-$13s over the recent data window, with lower highs and lower lows forming. That kind of pattern tells traders that supply is still in control and dip buying has not yet flipped the trend.
On the intraday 5‑minute snapshot, the stock traded in a very wide band, opening around the mid-$15s and flushing down into the high-$13s by the close. This sharp intraday slide, with the close pinned near the low, points to strong selling pressure and likely stops getting triggered. For short-term traders, that kind of move often marks either a breakdown continuation setup or the early stages of a high-risk bounce attempt.
Under the hood, SAIL posted about $1.07B in revenue with a hefty 66.4% gross margin, which is typical of a software-driven model. However, EBIT margin at roughly -17.8% and profit margin around -12% to -14% show the company is still losing money at the bottom line. The latest quarterly data shows $280.1M in revenue but a net loss of about $74.7M, or -$0.13 per share, yet free cash flow was a positive $32.5M and operating cash flow $38.2M. The balance sheet carries about $390.8M in cash, minimal debt, a current ratio of 1.4, and essentially no net leverage, giving SAIL a solid liquidity runway.
Conclusion
SailPoint Inc. (SAIL) gives traders a classic growth-versus-losses trade-off. The weekly and intraday charts both lean bearish right now, with a clear pattern of lower highs and a sharp breakdown toward the $13 handle. As Tim Bohen, lead trainer with StocksToTrade says, “There’s a pattern in everything; you just have to stick around long enough to see it.” That mindset applies here, as the tape is clearly telegraphing caution. That tells short-term traders to respect downside momentum until price can reclaim and hold prior support levels in the mid-$15s.
Financially, SAIL is a mixed bag: strong revenue scale, rich 66.4% gross margin, and positive free cash flow, but persistent net losses and negative returns on assets and equity. Valuation around 5.78x sales and over 40x cash flow implies the market still prices in meaningful future growth. With nearly $391M in cash, low liabilities, and no meaningful debt burden, SailPoint Inc. can likely keep funding its strategy, but traders must accept ongoing earnings red ink for now.
For active traders, the key is simple: treat SAIL as a momentum and liquidity play, not a safe haven. Breaks below recent lows open the door to further downside, while any firm reclaim of broken support could fuel short-covering bounces. As I often tell my students, “Your job is not to predict where SAIL should trade in theory — your job is to read what the tape and the numbers are actually telling you today.” This article is for educational and research purposes only. “,”scores”:{“risk-level”:”medium-high”},”trade”:”false
This is stock news, not investment advice. StocksToTrade News delivers real-time stock market updates tailored to highlight the key catalysts driving short-term price movements. Our coverage is designed for active traders and investors who thrive in fast-moving markets, with a focus on volatile sectors like penny stocks, AI stocks, Robinhood stocks and other momentum plays. From earnings reports and FDA approvals to mergers, new contracts, and unusual trading volume, we break down the events that can spark significant price action.
Looking to level up your trading game? Explore StocksToTrade, the ultimate platform for traders. With powerful tools designed for swing and day trading, integrated news scanning, and even social media monitoring, StocksToTrade keeps you one step ahead.
Check out our quick startup guide for new traders!
- How to Read Stock Charts: A Guide for Beginners
- Trading Plan: 6 Steps to Create One
- How To Create a Stock Watchlist
Ready to build your watchlists? Check out these curated lists:
Once your watchlist is set, take the next step and trade with confidence using StocksToTrade’s robust platform. Don’t miss out — grab your 14-day trial for just $7 and experience the edge you need to thrive in today’s fast-paced markets.