

SAGTEC GLOBAL LIMITED stocks have been trading up by 73.66 percent amid strong optimism from its latest strategic growth announcement.
Market Insights For Active SAGT Traders
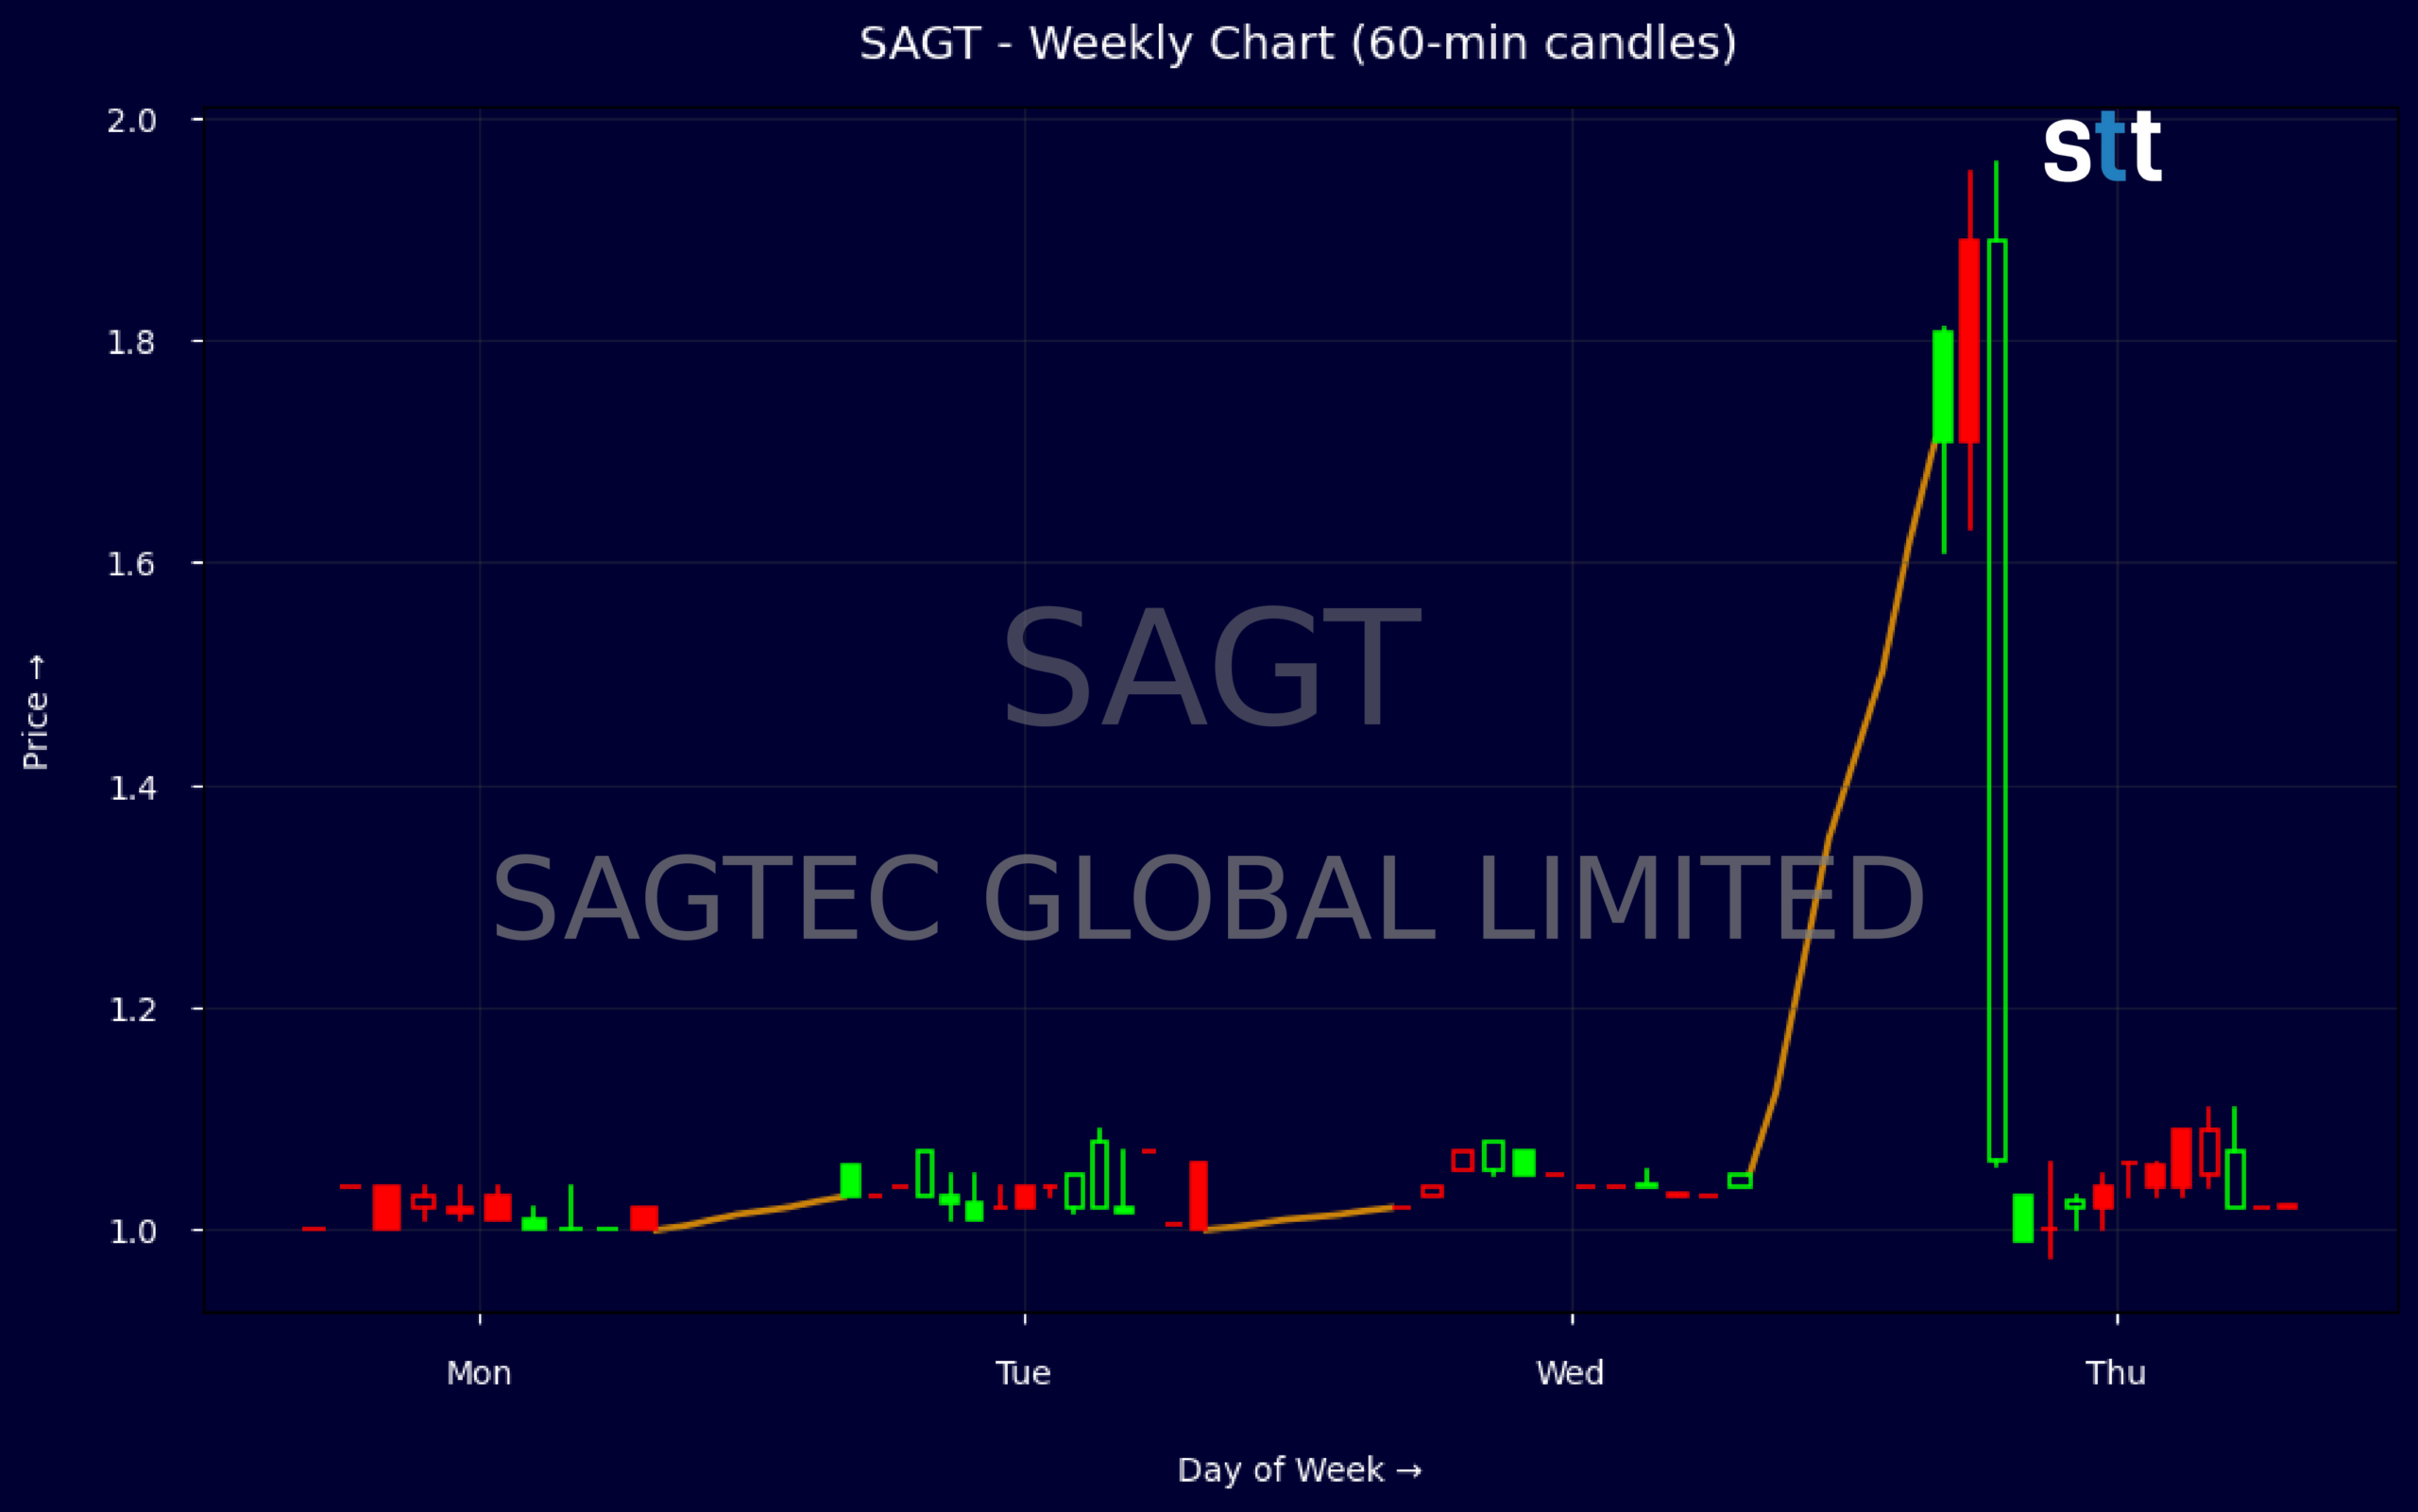
- Weekly chart shows SAGT breaking out from $1.00 to near $1.81, signaling a sharp volatility expansion.
- Intraday action reveals a fast fade from above $1.08 to $0.99, highlighting aggressive profit-taking.
- Valuation remains modest with a price-to-sales ratio near 1.25 and price-to-book below 1.0.
- Balance sheet shows low long-term debt versus equity, giving SAGTEC GLOBAL LIMITED financial flexibility.
- Traders are focusing on $1.00 as a key support pivot and the $1.80 area as the first major resistance.
Weekly Update Jun 15 – Jun 19, 2026: On Sunday, June 21, 2026 SAGTEC GLOBAL LIMITED stock [NASDAQ: SAGT] is trending up by 73.66%! Discover the key drivers behind this movement as well as our expert analysis in the detailed breakdown below.
Technology industry expert:
Analyst sentiment – positive
SAGT operates as a micro-cap software/IT services name with modest scale (TTM revenue ~$77.5m, revenue/share $6.18) and trading at ~1.25x sales and ~0.95x book (BVPS $8.06), implying the market assigns almost no franchise premium. Leverage is low (long‑term debt ~$4.9m, long‑term debt to capital 5%, leverage ratio 1.2) and liquidity is strong (cash ~$10.9m, working capital ~$16.4m). ROIC at 11.36% is solid for a company valued roughly at tangible book, signaling underappreciated capital efficiency.
Technically, SAGT just broke out from a tight, illiquid base in the low-$1.00 range. Weekly data show a sharp expansion from $0.99 to an intraperiod high of $1.96, closing at $1.8061, with prior days clustered at $1.00–1.08, suggesting a volumetric spike and initiation of a new uptrend. The dominant trend is now bullish with early-stage momentum. A key actionable level is $1.00–1.05 as primary support; a decisive break back below $1.00 would invalidate the breakout thesis.
More Breaking News
- FDXF Stock Climbs As Traders Focus On Freight Cash Flows
- RIG Stock Climbs As Backlog And Valaris Deal Transform Outlook
- SPCX Slides As Policy Shocks And New Rivals Hit SpaceX
- WKHS Stock Draws Traders As EV Orders Grow And AI Pivot Emerges
With no material recent news, the move appears technically driven and positioning-related rather than fundamentally re-rated, but SAGT’s clean balance sheet and double‑digit ROIC compare favorably to many small-cap Technology and Software & IT Services peers that trade at higher P/S and P/B multiples. I view fair value near 1.5–1.8x book, implying a 6–12 month target range of $12–$14 per share pre-split equivalent, with near-term resistance at $2.00 and support at $1.00. Risk/reward is attractive but liquidity risk is high.
Quick Financial Overview
SAGTEC GLOBAL LIMITED, trading under ticker SAGT, is showing a mix of strong balance sheet backing and suddenly aggressive price action. Revenue is about $77.5M, translating to roughly $6.18 per share, while book value per share sits near $8.06. With a price-to-sales ratio around 1.25 and price-to-book ratio about 0.95, the stock is priced slightly below its accounting equity value, which can attract value-focused traders when momentum appears.
The latest balance sheet data shows total assets around $116.7M against total liabilities of about $14.7M, leaving stockholders’ equity just over $101.2M. Long-term debt is modest at roughly $4.9M, and current assets exceed current liabilities by about $16.4M of working capital. A leverage ratio near 1.2 and a reported 11.36% return on invested capital suggest SAGT has room to fund operations and selective growth without heavy financial strain.
On the chart, weekly data shows SAGT holding the $1.00 area for several sessions, then exploding from a $0.99 low to a $1.96 high, closing the latest bar around $1.81. That kind of near-doubling intrawweek move is a textbook volatility event that often pulls in momentum traders. Intraday, a 5-minute candle shows price opening at $1.08, briefly pushing to $1.09, then flushing to $0.975 and closing at $0.99, a clear sign of intraday supply hitting the tape. Together, this suggests a name transitioning from quiet range action into a more speculative trading vehicle where risk management becomes critical.
Conclusion
SAGT: Volatility, Value, And Key Technical Zones
SAGTEC GLOBAL LIMITED now sits at an interesting crossroads for active traders. On one hand, the balance sheet looks solid, with over $10.9M in cash, low long-term debt, and equity of roughly $101.2M supporting a market price that still values the company near book. On the other hand, the recent swing from a $0.99 low to a $1.96 high, and a close around $1.81, shows that SAGT has shifted into a high-beta trading phase.
From a trading standpoint, the $1.00 area is now a clear line in the sand. Holding above that level keeps the breakout thesis alive; repeated closes below it would signal the spike is failing. The $1.80–$1.96 band is the first real supply zone to watch, as sellers already appeared there on the weekly bar. With valuation not stretched and volatility heating up, SAGT offers a classic mix of reward potential and downside risk that must be sized carefully.
For educational and research purposes, traders should treat SAGT as a technical and liquidity-driven play, backed by a reasonably strong balance sheet but still subject to sharp swings. As Tim Bohen, lead trainer with StocksToTrade says, “There’s a pattern in everything; you just have to stick around long enough to see it.” That mindset is crucial here: patiently tracking how price reacts around these key zones can help traders better understand whether SAGT is building a sustainable trend or merely offering a short-lived spike. As I often tell my students, “Respect the levels, respect the volatility, and never confuse a fast move with a free lunch,” and that applies directly to how SAGT is trading right now.”,”scores”:{“risk-level”:”high”},”trade”:”true
This is stock news, not investment advice. StocksToTrade News delivers real-time stock market updates tailored to highlight the key catalysts driving short-term price movements. Our coverage is designed for active traders and investors who thrive in fast-moving markets, with a focus on volatile sectors like penny stocks, AI stocks, Robinhood stocks and other momentum plays. From earnings reports and FDA approvals to mergers, new contracts, and unusual trading volume, we break down the events that can spark significant price action.
Looking to level up your trading game? Explore StocksToTrade, the ultimate platform for traders. With powerful tools designed for swing and day trading, integrated news scanning, and even social media monitoring, StocksToTrade keeps you one step ahead.
Check out our quick startup guide for new traders!
- How to Read Stock Charts: A Guide for Beginners
- Trading Plan: 6 Steps to Create One
- How To Create a Stock Watchlist
Ready to build your watchlists? Check out these curated lists:
Once your watchlist is set, take the next step and trade with confidence using StocksToTrade’s robust platform. Don’t miss out — grab your 14-day trial for just $7 and experience the edge you need to thrive in today’s fast-paced markets.