

PicoCELA Inc. stocks have been trading down by -12.86 percent amid investor concern over its latest technology partnership outlook.
Market Insights For Active PCLA Traders
- Recent weekly action shows a surge from the mid-$6 area to above $10 before a pullback, signaling rising interest and volatility in PicoCELA Inc.
- Intraday range between $8.75 and $15.45 in a single session highlights extreme volatility that can offer opportunity but also elevated risk.
- Revenue of about $544.7M with a price-to-sales ratio above 27 suggests the market is already pricing in significant future growth.
- Deep negative margins and weak returns on capital mean PicoCELA Inc. is still firmly in a high-risk, early-stage phase.
- Balance sheet liquidity and working capital provide runway, but traders should respect sharp swings in PCLA while the business remains unprofitable.
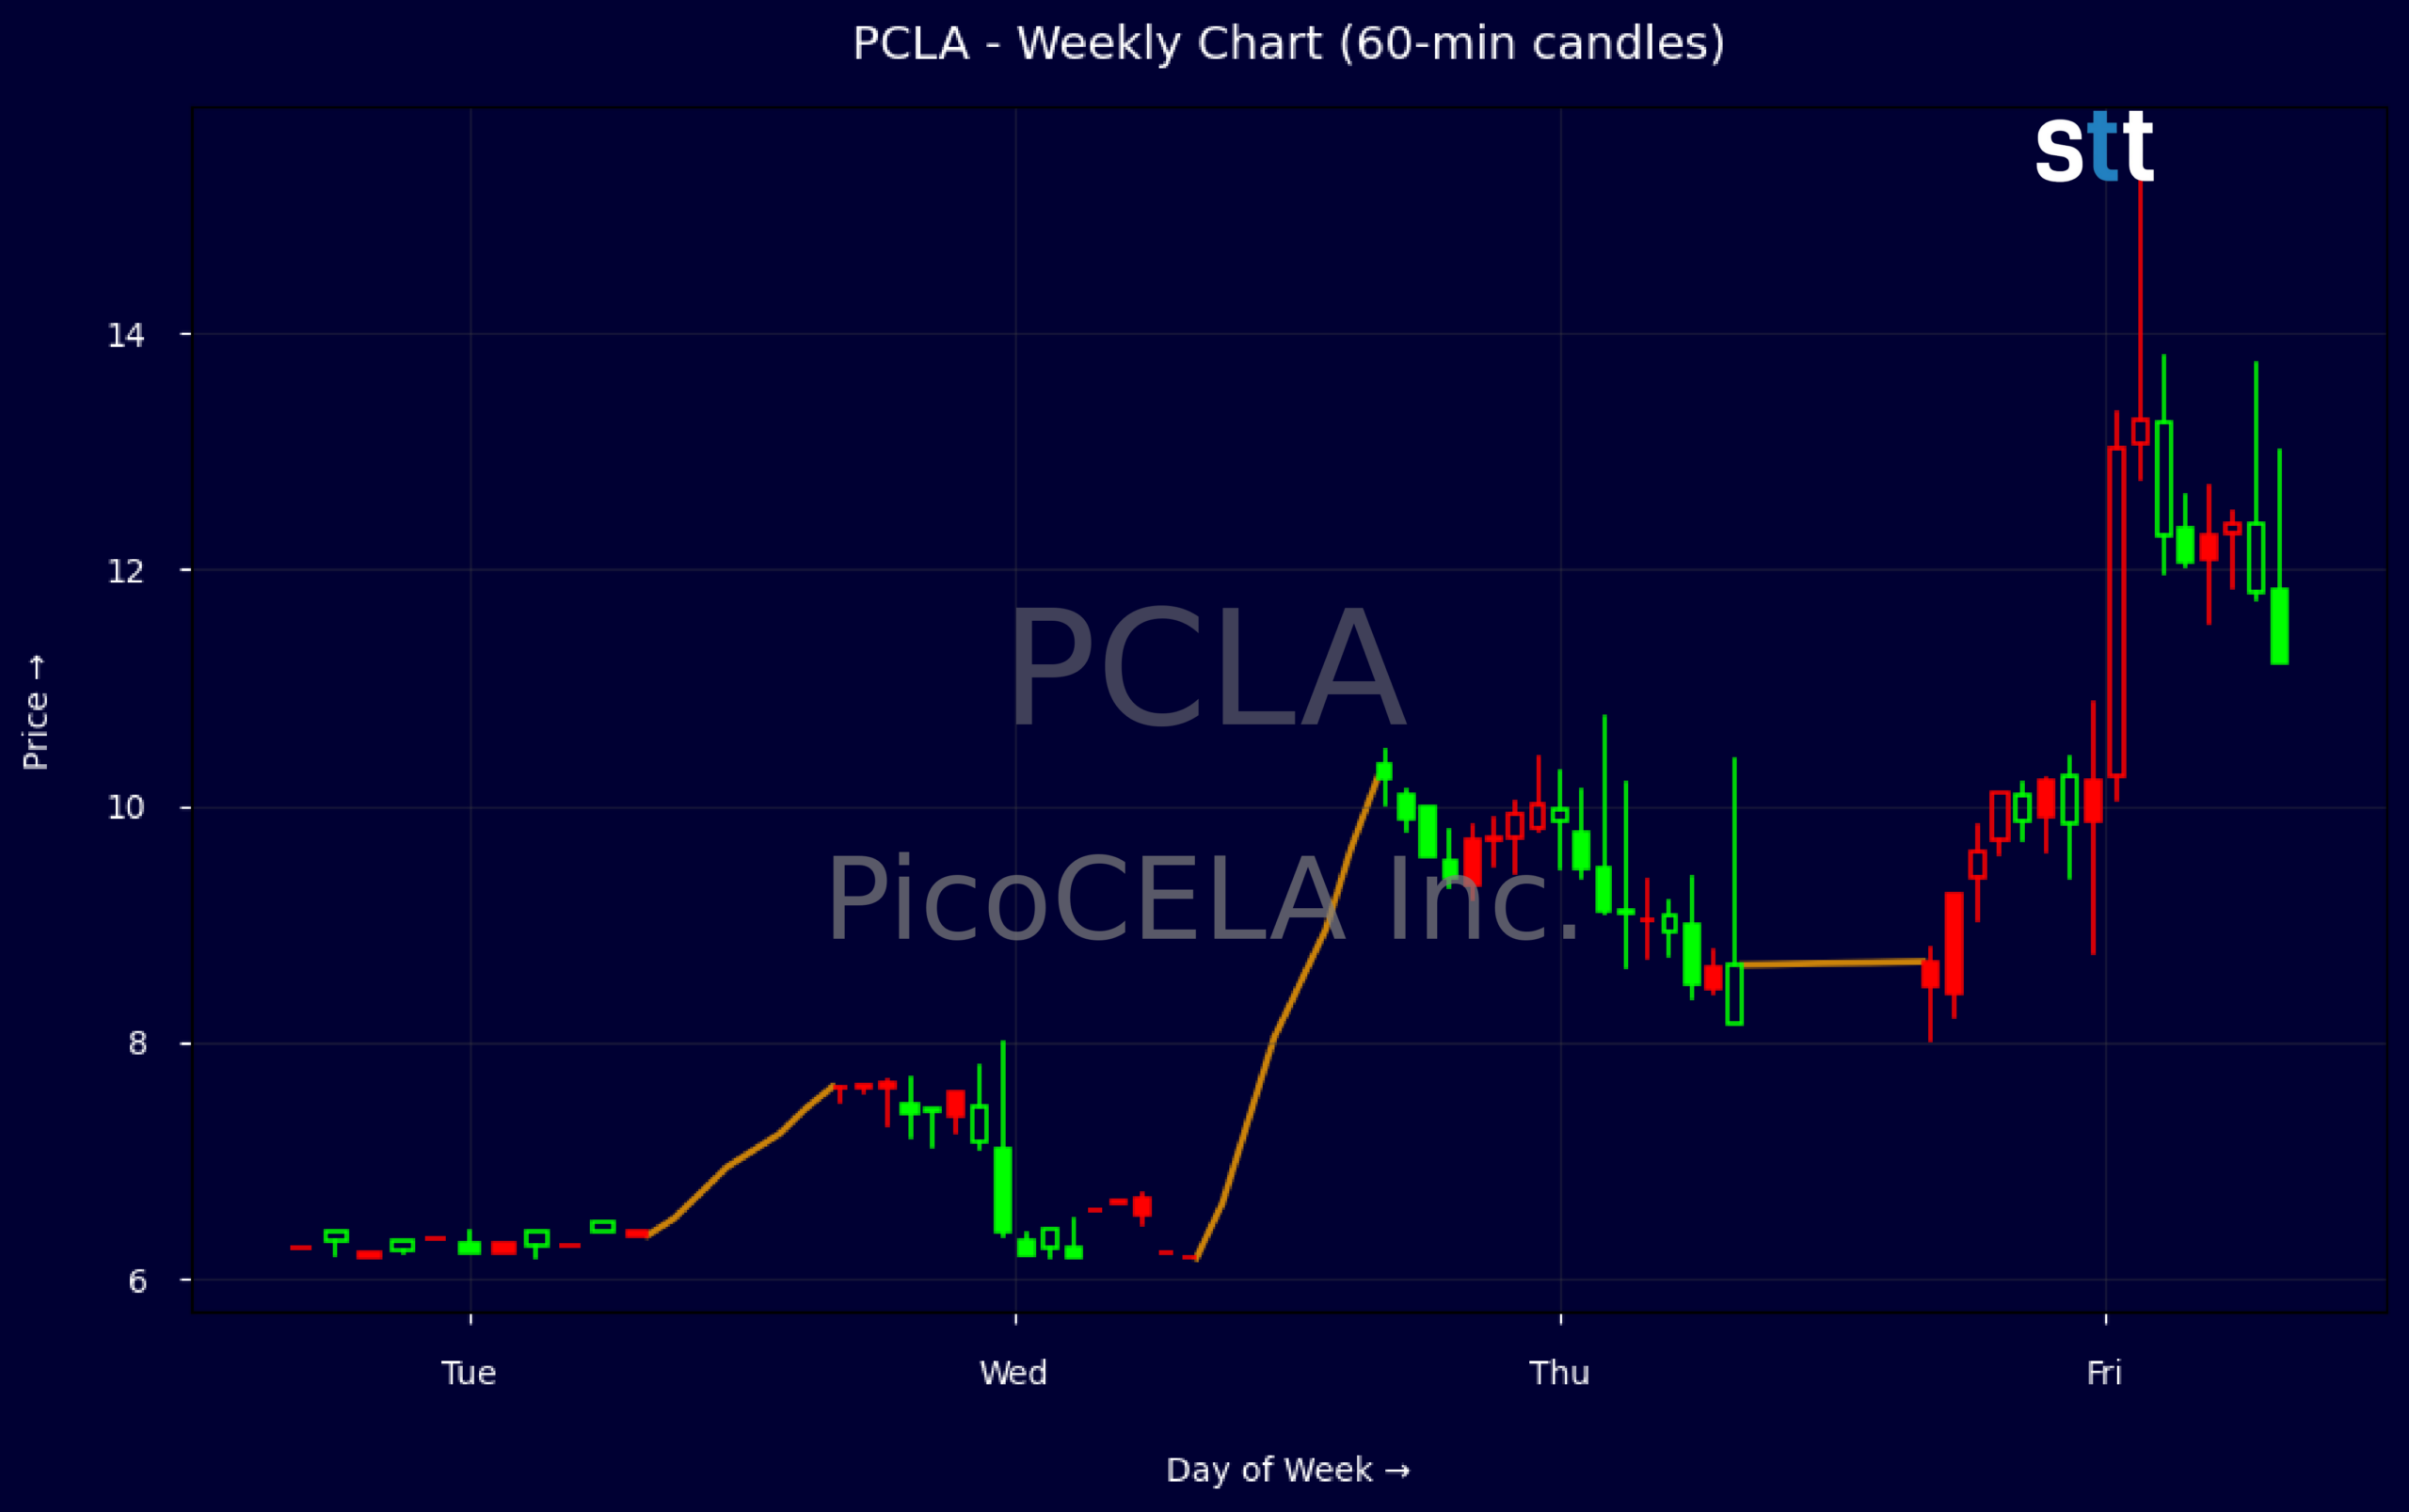
Weekly Update Sep 07 – Sep 11, 2026: On Saturday, September 12, 2026 PicoCELA Inc. stock [NASDAQ: PCLA] is trending down by -12.86%! Discover the key drivers behind this movement as well as our expert analysis in the detailed breakdown below.
Media industry expert:
Analyst sentiment – negative
PCLA operates as a high-growth, loss-making media/telecom platform with extreme valuation. FY revenue of ~$545m and price-to-sales of 27x imply an enterprise value heavily predicated on future scalability, while pre-tax margin of -114% and ROE of -16% underscore a structurally unprofitable model today. The balance sheet is liquid and under-levered: cash of ~$535m, working capital of ~$527m, and long-term debt of only ~$10m against equity of ~$470m provide ample runway but little margin for execution failure.
Technically, the weekly sequence from 6.25 → 7.61 → 10.35, before a reversal to 8.47, shows an explosive upside breakout followed by a sharp correction, consistent with speculative momentum unwinding. Intraday 5-minute candles (with elevated volume on the spike and heavy selling into the 10–10.5 zone) confirm strong overhead supply there. The dominant trend is still short-term up but fragile; 8.00 is the key actionable level – buyers should only engage on sustained closes above 8.00 with tight risk limits.
More Breaking News
- CareDx Stock Jumps As Earnings Beat And Guidance Surge Draw Trader Focus
- SNDG ETF Slides As Volatility Tests Momentum Traders
- WFF Stock Plunges Then Bases As Volatility Grips Chart
- Global Payments Stock Climbs As Analysts Bet On Worldpay Upside
With no substantive near-term news, PCLA trades as a high-beta proxy on sentiment around premium media, connectivity, and platform assets versus broader Media and Telecom indices that carry lower growth but positive earnings. Sector leaders trade on mid-single-digit sales multiples; PCLA at ~27x sales and deeply negative margins is priced for near-perfect execution. My verdict is negative: risk/reward is skewed lower. Key resistance is 10.50, near-term support 8.00, with downside risk toward 6.50.
Quick Financial Overview
PCLA, the ticker for PicoCELA Inc., is showing the kind of volatility short-term traders look for. On the weekly chart, price pushed from around $6.25 to $10.35, then faded to $8.47. That pattern tells you momentum came in hard, then met selling pressure, which often leads to a consolidation or a sharper mean reversion. For traders, that $10.35 zone now stands out as a clear recent high and potential resistance.
The intraday snapshot reinforces the high-risk profile. A single session with a high of $15.45 and a low of $8.75, closing around $10.11, is a huge range. That type of candle often reflects aggressive buying, fast profit-taking, and wide spreads. Day traders in PCLA need tight trade plans and must size for the possibility of multiple-dollar swings either way.
On the fundamentals, PicoCELA Inc. generates about $544.7M in revenue, yet carries a pretax profit margin near -114%. Return on assets at roughly -7.6% and return on equity around -16% show the core business is still burning value. At the same time, the balance sheet lists about $534.9M in cash and short-term investments against total liabilities of roughly $617.2M and current debt near $261.9M. Working capital of about $527.4M suggests decent near-term flexibility, but a price-to-sales ratio around 27.3 and price-to-book near 31.7 indicate PCLA trades as a high-expectation, high-multiple name.
Conclusion
PicoCELA Inc. presents a classic high-beta, story-driven profile where price is far ahead of current earnings power. The weekly push from the $6 area to above $10, followed by a pullback to the high-$8 range, shows that momentum traders have already discovered PCLA. At the same time, the wild intraday candle with a range from the mid-$8s to the mid-$15s makes it clear that slippage and fast reversals are part of the game here.
Financially, PCLA is a work in progress. Strong revenue scale and large cash reserves give the company time, but very negative margins and weak returns on capital signal that any long-side swing trade should be treated as speculative. The rich valuation ratios confirm that traders are paying up for future potential, not current profitability. If that growth narrative stalls, the downside can be sharp.
For active traders, the key is to anchor on levels and risk. The recent high around $10.35 on the weekly and the extreme intraday high near $15.45 define the top of the current range, while the $8 handle marks a nearby downside reference. Those levels can guide entries, stops, and profit targets in PCLA. As I teach my students, “You trade what the tape is telling you, not the story you wish were true — price, volume, and risk management always come first.” In other words, the chart has to justify the trade. As Tim Bohen, lead trainer with StocksToTrade says, “A good trade setup checks all the boxes—volume, trend, catalyst. Don’t trade if you’re missing pieces of the puzzle.”.
This is stock news, not investment advice. StocksToTrade News delivers real-time stock market updates tailored to highlight the key catalysts driving short-term price movements. Our coverage is designed for active traders and investors who thrive in fast-moving markets, with a focus on volatile sectors like penny stocks, AI stocks, Robinhood stocks and other momentum plays. From earnings reports and FDA approvals to mergers, new contracts, and unusual trading volume, we break down the events that can spark significant price action.
Looking to level up your trading game? Explore StocksToTrade, the ultimate platform for traders. With powerful tools designed for swing and day trading, integrated news scanning, and even social media monitoring, StocksToTrade keeps you one step ahead.
Check out our quick startup guide for new traders!
- How to Read Stock Charts: A Guide for Beginners
- Trading Plan: 6 Steps to Create One
- How To Create a Stock Watchlist
Ready to build your watchlists? Check out these curated lists:
Once your watchlist is set, take the next step and trade with confidence using StocksToTrade’s robust platform. Don’t miss out — grab your 14-day trial for just $7 and experience the edge you need to thrive in today’s fast-paced markets.