

Origin Materials Inc. stocks have been trading up by 15.45 percent amid heightened optimism around its sustainable materials innovations.
What Traders Need To Know
- ORGN pushed from roughly $1.23 to $1.43 intraday on heavy 5‑minute candle range, signaling aggressive short-term buying.
- Weekly chart shows ORGN running from about $1.23 support to $2.02 high before settling near $1.42, confirming a strong volatility expansion.
- Recent financing by Origen Resources in Brazil is unrelated to Origin Materials Inc. but shows ongoing risk capital activity in small caps.
- ORGN trades at a low price-to-sales and price-to-book ratio, highlighting a deep-discount story with heavy operating losses.
- Weak profitability and negative cash flow make ORGN a pure trading vehicle, not a fundamentals-driven swing for most short-term traders.
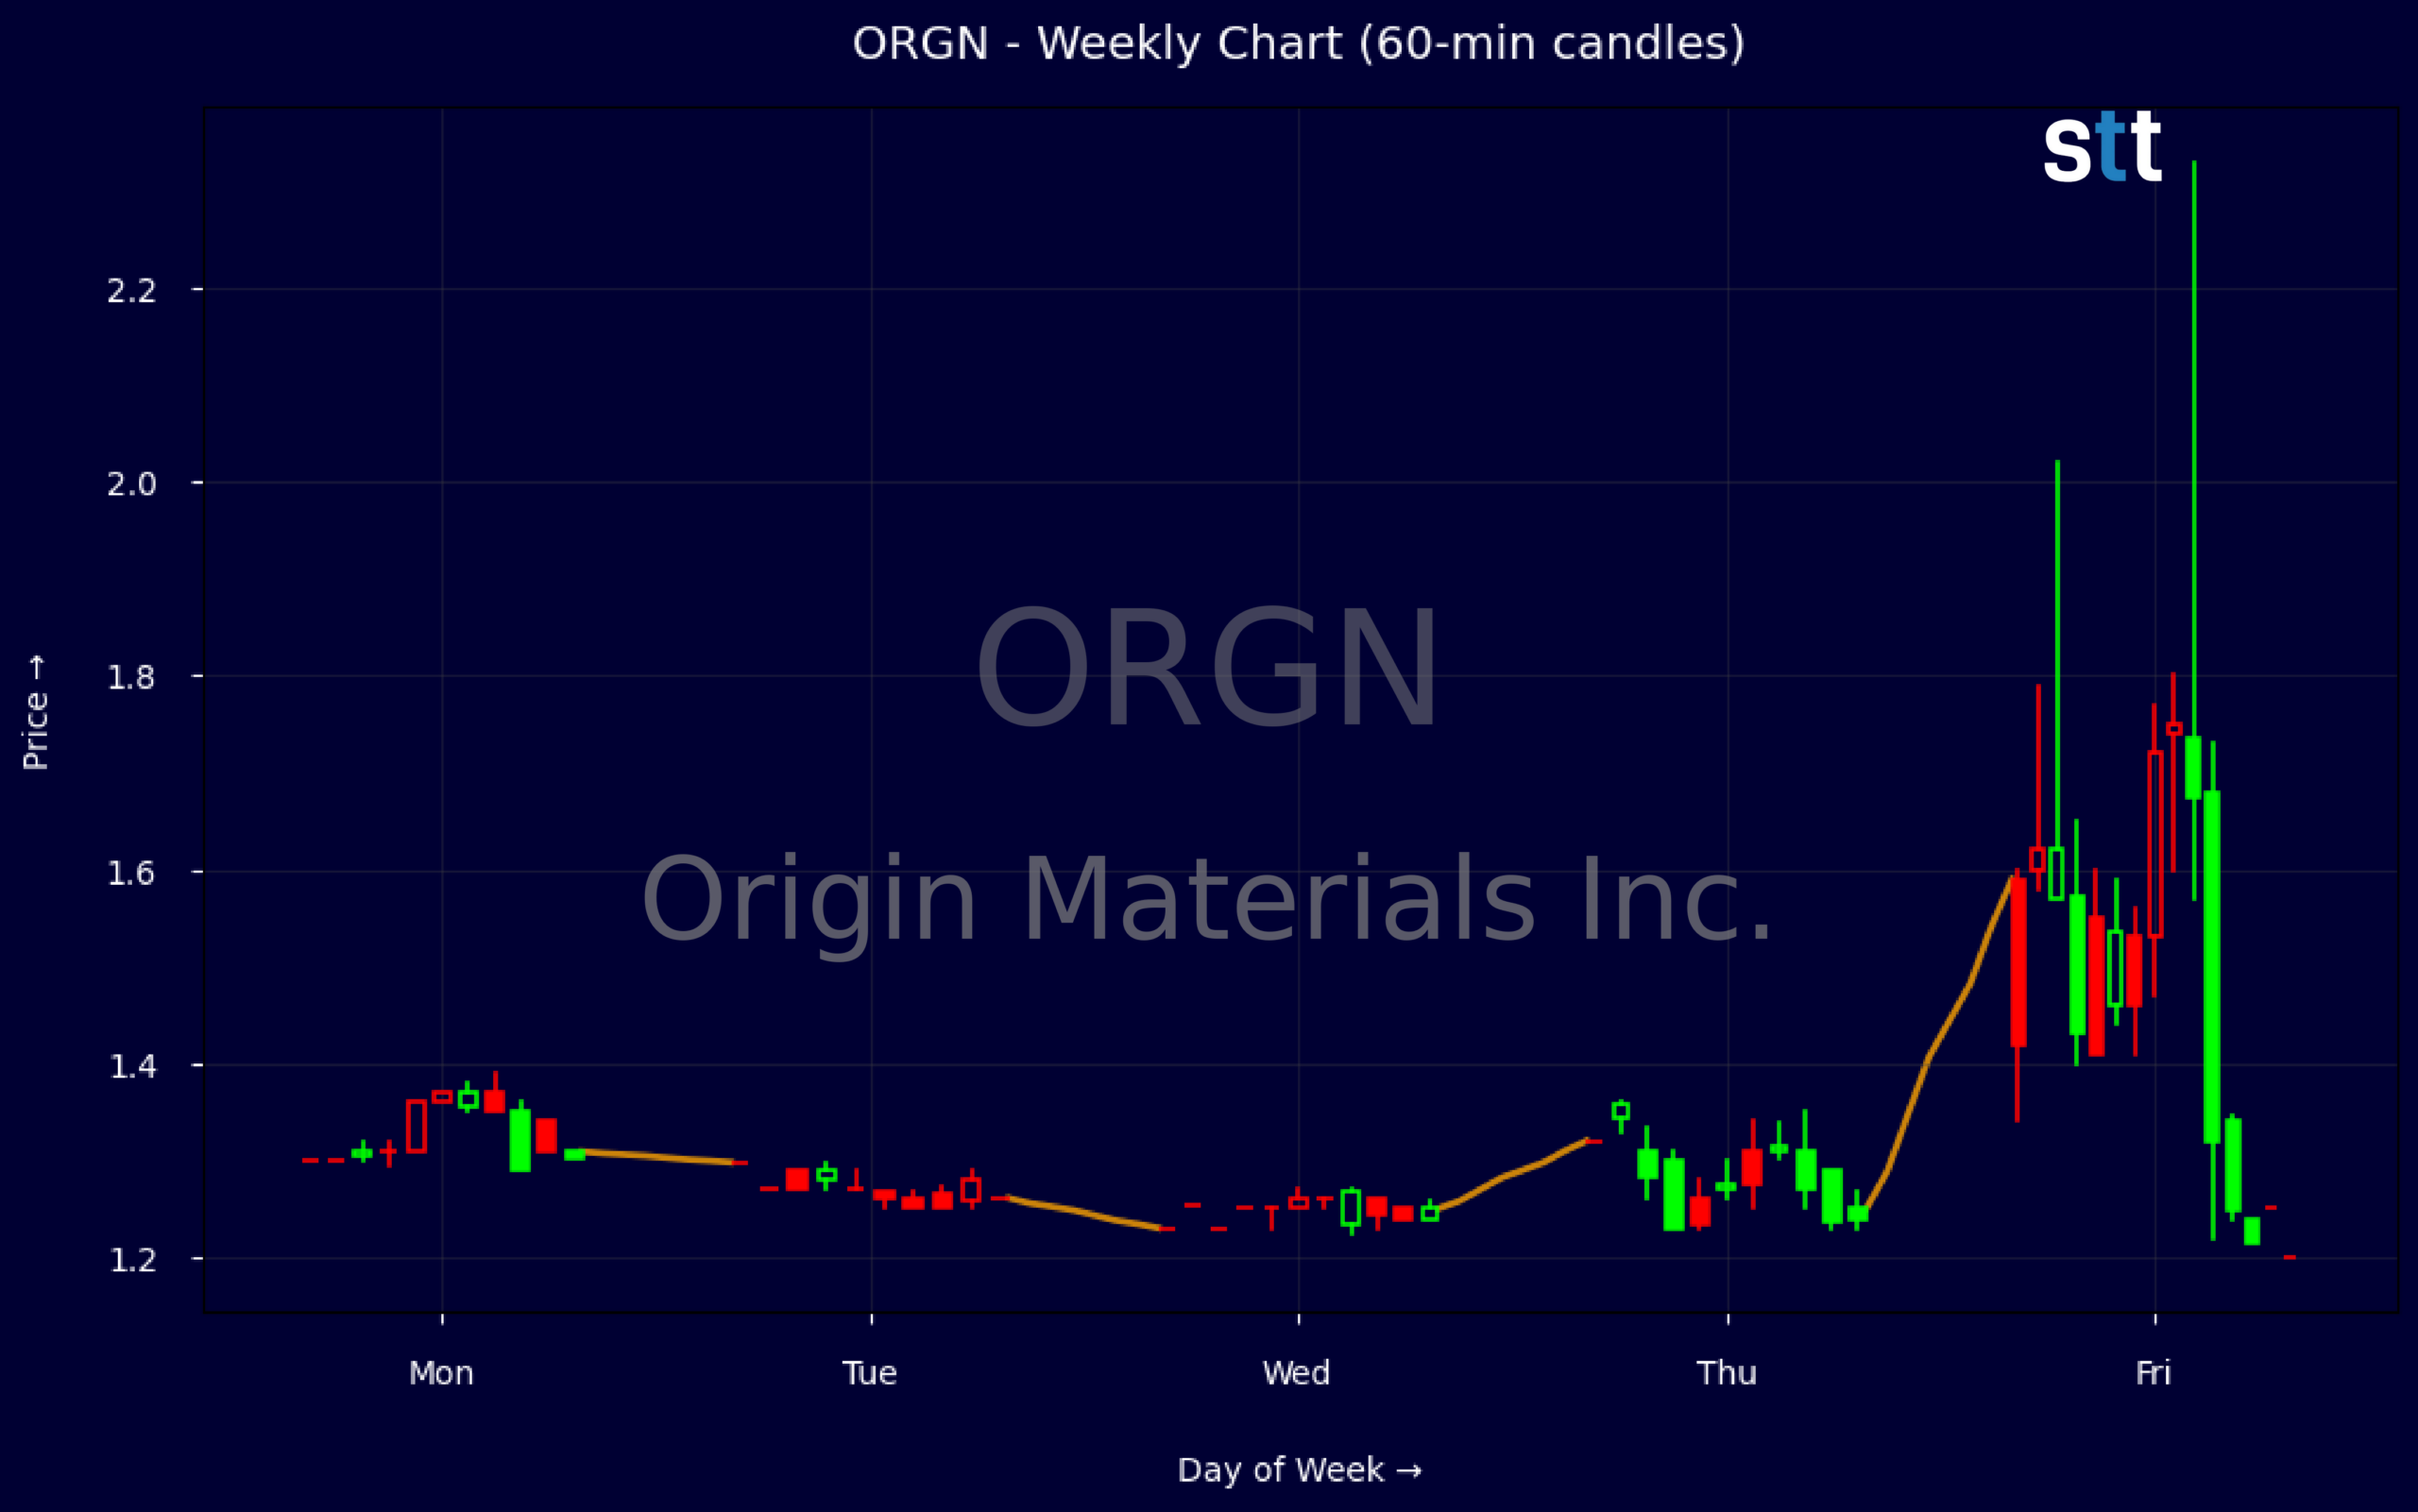
Weekly Update May 11 – May 15, 2026: On Saturday, May 16, 2026 Origin Materials Inc. stock [NASDAQ: ORGN] is trending up by 15.45%! Discover the key drivers behind this movement as well as our expert analysis in the detailed breakdown below.
Materials industry expert:
Analyst sentiment – negative
Origin Materials (ORGN) is a pre‑commercial specialty materials platform with effectively no meaningful revenue scale yet (Q1 revenue $0.48M) and extremely weak profitability metrics (EBIT margin ≈ -1,315%, ROE ≈ -113%). Cash burn remains heavy with Q1 operating cash flow of -$4.9M and free cash flow of -$11.9M, but the balance sheet is still relatively clean: current ratio 2.8, debt/equity 0.12, and price‑to‑book of 0.06 implying deep “distress” valuation rather than a normal discount.
Technically, ORGN has shifted from a flat base to a high‑volatility rebound. Over the last five sessions, price jumped from ~1.24 to a 2.02 intraday high before settling at 1.42, signaling aggressive speculative buying followed by profit‑taking. The dominant near‑term trend is up, but extended. Key actionable level: 1.25–1.30 as first support; pullbacks into that zone with stabilizing 5‑minute candles and above‑average volume offer the only acceptable low‑risk entry. A decisive break below 1.20 invalidates the long setup.
More Breaking News
- AVGO Stock Firms Up As Broadcom Shows Strong Profits And Cash
- GoDaddy GDDY Jumps As Earnings Beat And AI Airo Shine
- WULF Stock Climbs As AI Data-Center Funding Risks Mount
- FDXF Stock Climbs As Traders Focus On Debt, Momentum
Recent capital‑raising news in the broader materials space (e.g., small private placements to fund early‑stage projects) underlines how far ORGN sits from the more cash‑generative chemicals benchmarks, which typically show positive ROIC and stable pricing power. ORGN remains a binary, development‑stage story rather than a core materials holding. My verdict: speculative only. Near‑term resistance sits at 2.00; support at 1.25. Favor a trading range of 1.20–2.00 with no fundamental justification above $2 until revenue scales.
Quick Financial Overview
Origin Materials Inc. (ORGN) is trading at deep value metrics on paper, with price-to-sales around 0.35 and price-to-book near 0.06. That tells traders the market is heavily discounting the company’s equity relative to its $18.9M in revenue and roughly $88.3M of common equity. The gap between accounting value and market price is wide, which often creates sharp, sentiment-driven moves when any catalyst hits.
The problem is profitability. ORGN posted about $0.5M of quarterly revenue against roughly $16.7M in total expenses, driving net income to about -$17.7M and EBITDA near -$16.4M. Margins are deeply negative across the board, and returns on equity and assets are also strongly negative, so fundamentals alone do not support a steady uptrend. However, the balance sheet still shows around $32.6M in cash and short-term investments, plus a current ratio near 2.8, giving the company some room to keep operating and funding losses.
On the chart, weekly data shows ORGN grinding around $1.23 early in the period, then spiking to a $2.02 high before closing near $1.42. That is a meaningful volatility expansion, especially when the 5‑minute candle shows a huge intraday range from $1.22 to $2.33 and a close around $1.43. For short-term traders, this kind of range signals strong momentum and possible short covering, but also warns that any reversal could be just as fast on the way down.
Conclusion
This is stock news, not investment advice. StocksToTrade News delivers real-time stock market updates tailored to highlight the key catalysts driving short-term price movements. Our coverage is designed for active traders and investors who thrive in fast-moving markets, with a focus on volatile sectors like penny stocks, AI stocks, Robinhood stocks and other momentum plays. From earnings reports and FDA approvals to mergers, new contracts, and unusual trading volume, we break down the events that can spark significant price action.
Looking to level up your trading game? Explore StocksToTrade, the ultimate platform for traders. With powerful tools designed for swing and day trading, integrated news scanning, and even social media monitoring, StocksToTrade keeps you one step ahead.
Check out our quick startup guide for new traders!
- How to Read Stock Charts: A Guide for Beginners
- Trading Plan: 6 Steps to Create One
- How To Create a Stock Watchlist
Ready to build your watchlists? Check out these curated lists:
Once your watchlist is set, take the next step and trade with confidence using StocksToTrade’s robust platform. Don’t miss out — grab your 14-day trial for just $7 and experience the edge you need to thrive in today’s fast-paced markets.