

Olin Corporation faces heightened pressure as regulatory investigations overshadow earnings outlook, and its stocks have been trading down by -15.52 percent.
What Traders Need To Know
- Q2 results showed a net loss of $0.12 per share versus a $0.01 loss a year ago, badly missing expectations for a $0.10 profit and knocking the stock over 5% lower after hours.
- Analyst confidence has cooled, with BMO Capital cutting its price target from $30 to $25, citing weak housing and auto demand and pressure on commodity chemicals into the back half of the year.
- Goldman Sachs also lowered its OLN target from $31 to $24, warning that expected benefits from the Middle East conflict are underdelivering and that feedstock constraints could pressure earnings from Q3 onward.
- The combination of a surprise quarterly loss, softer revenue, and lower sell-side targets puts Olin Corporation firmly in a caution zone for short-term traders.
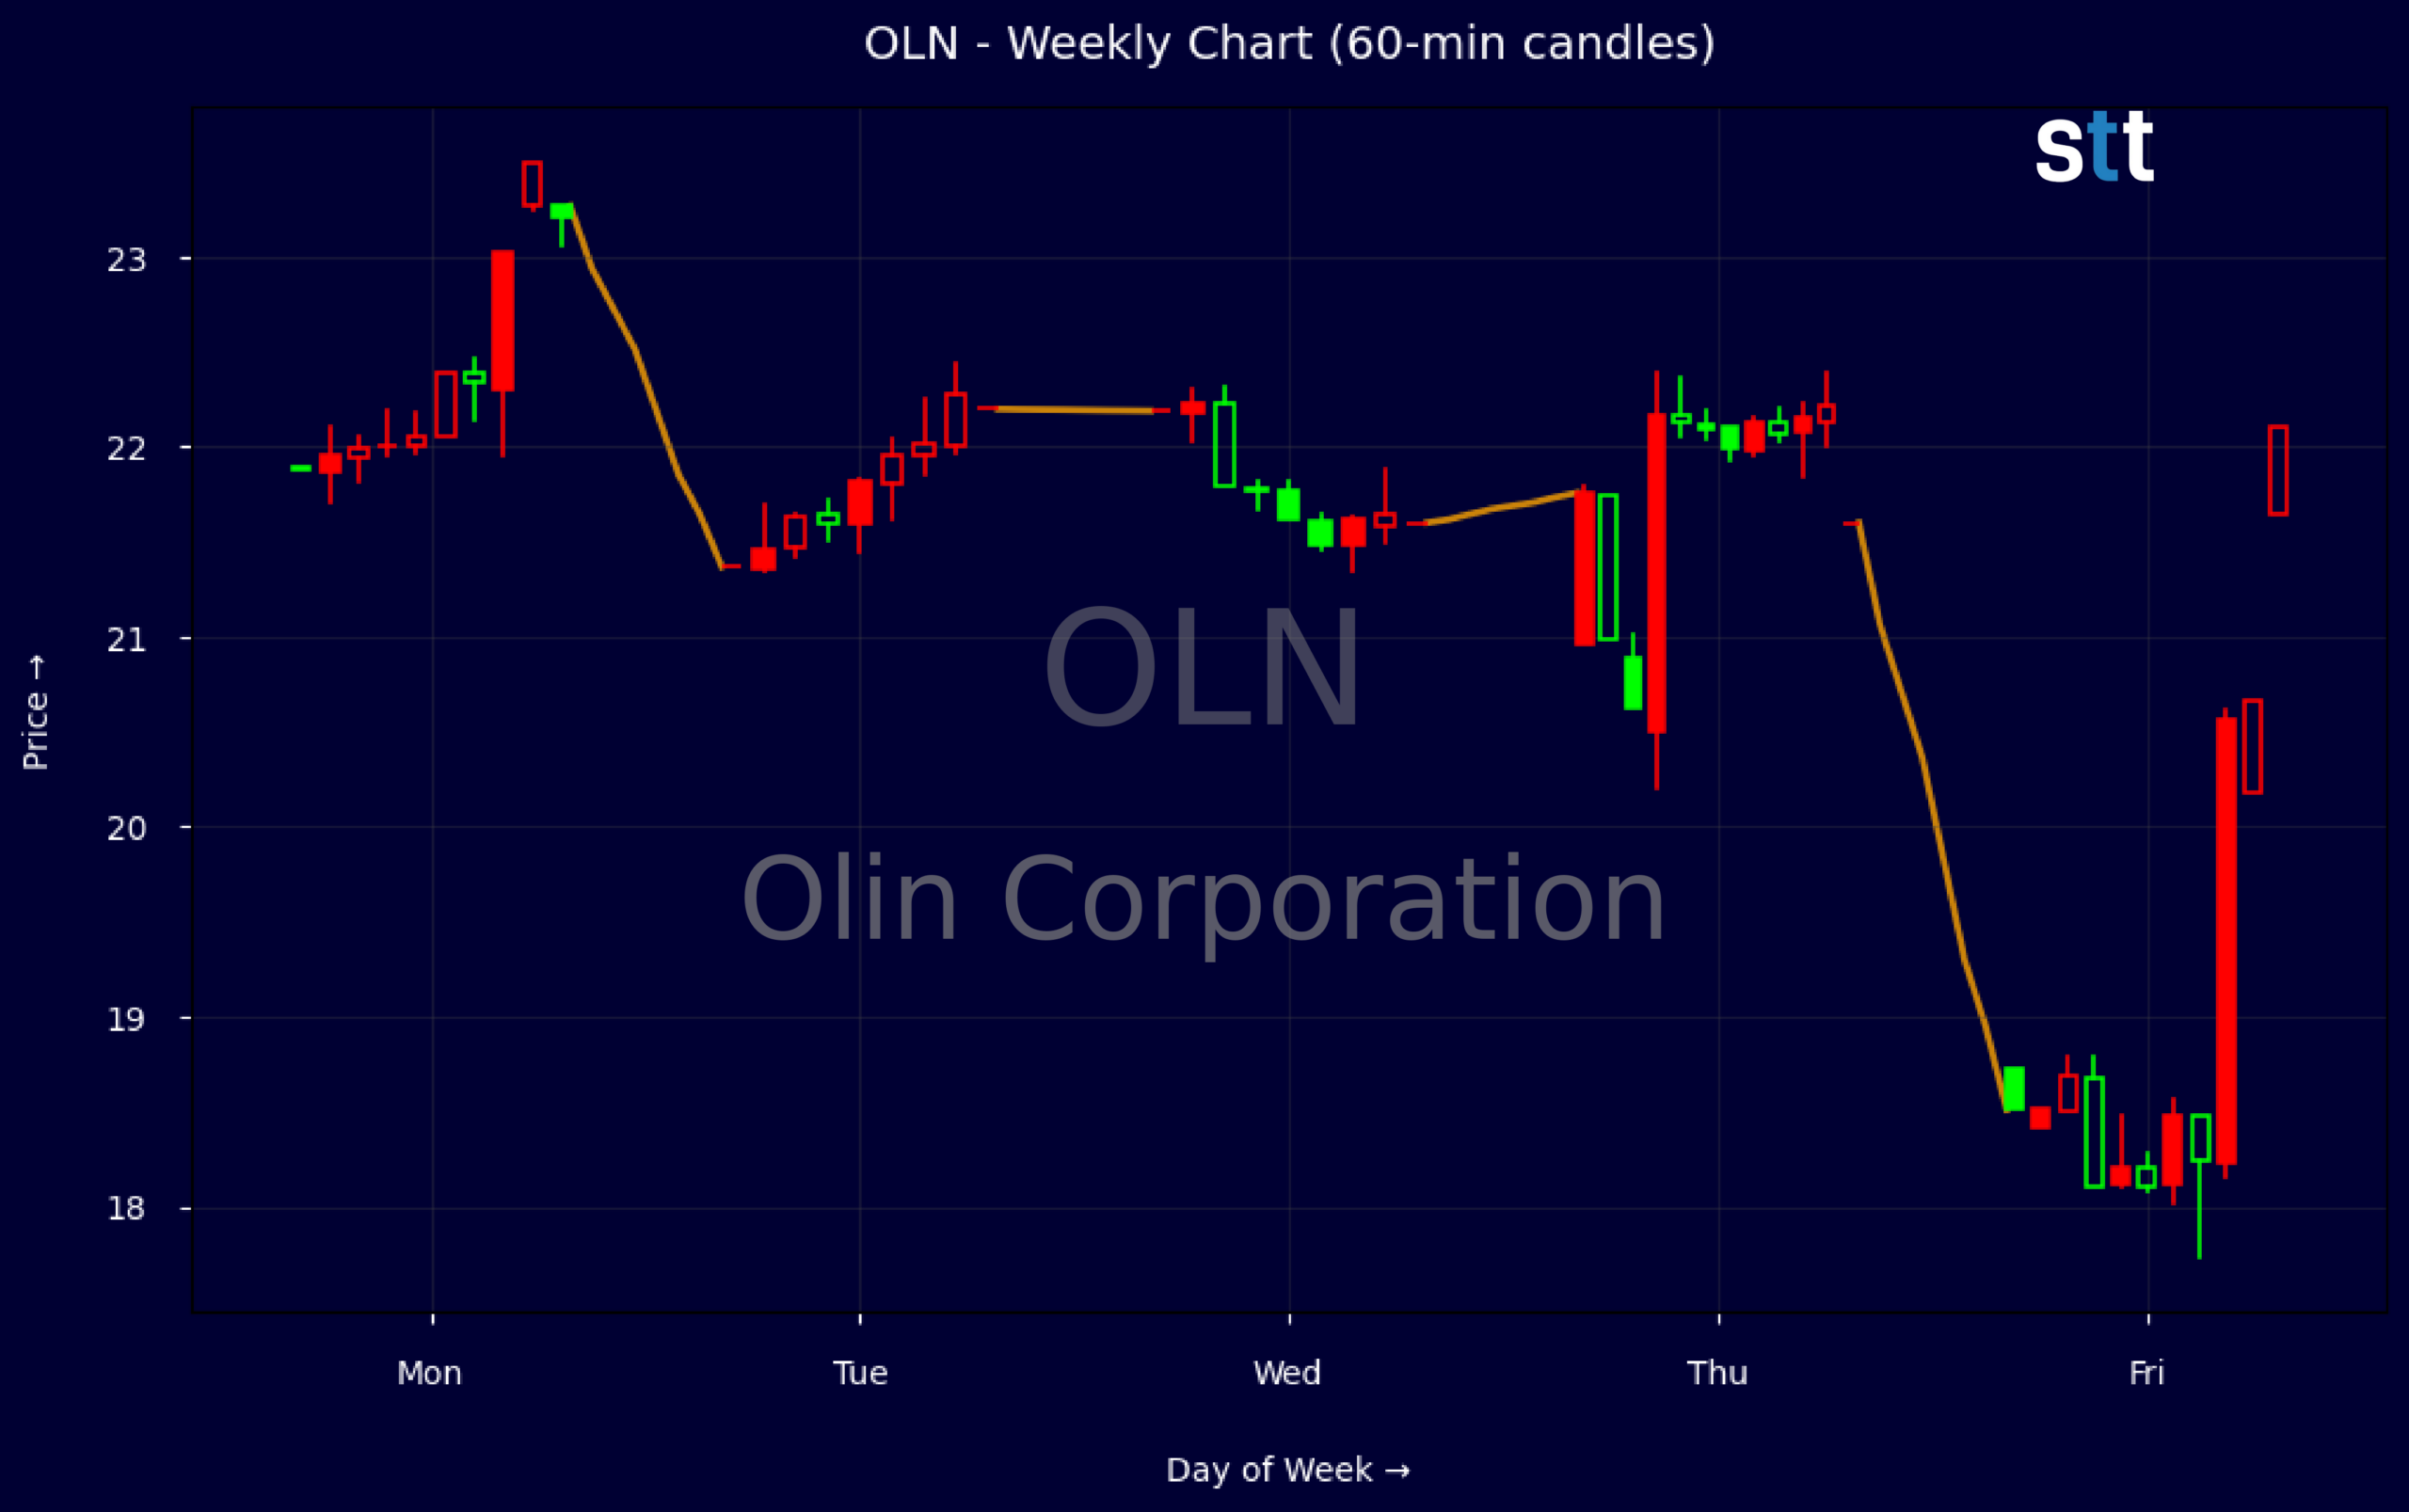
Weekly Update Jul 27 – Jul 31, 2026: On Sunday, August 02, 2026 Olin Corporation stock [NYSE: OLN] is trending down by -15.52%! Discover the key drivers behind this movement as well as our expert analysis in the detailed breakdown below.
Materials industry expert:
Analyst sentiment – negative
Olin’s latest quarter confirms a pressured but not broken chemicals franchise: EBITDA margin near 10% for the quarter (vs. 6.1% LTM), but EBIT margin is thin and consolidated profit margins remain negative, with ROE LTM at roughly -11%. Revenues are shrinking low single digits over 3–5 years, highlighting a structurally weak pricing environment. Leverage is elevated (total debt-to-equity ~2.0x, interest coverage only 2.3x), and quarterly free cash flow was -$21 million despite modest capex, forcing reliance on incremental debt to fund dividends.
Technically, the stock has broken down from the low-$20s trading band: after prints at $21.9–22.2 early in the week, sellers drove price sharply lower to close at $18.73, confirming a decisive downside break and establishing a new short-term downtrend on the weekly. Intraday 5‑minute action shows heavy, persistent selling with weak bounces, signaling distribution rather than accumulation. The key actionable level is $21.50–22.00, now strong overhead resistance; below, next meaningful support sits near $18.00, where buyers might tentatively emerge.
More Breaking News
- BTG Stock Pulls Back As Charts Flash Key Support
- SNDG ETF Slides As Volatility Pressures Bullish Traders
- SNDG ETF Slides As Volatility Grips Short-Term Traders
- BMNR Stock Pulls Back As Traders Gauge Risk
Fundamentally and sentiment-wise, the setup is adverse: EPS badly missed (+$0.10 expected vs. -$0.12 reported), revenue underwhelmed, and both BMO and Goldman cut targets into the mid‑$20s with neutral stances, citing macro softness and weaker basic chemicals economics. Relative to Materials and diversified Chemicals benchmarks, Olin combines higher cyclicality with weaker balance sheet quality and negative earnings momentum. Base case: tradeable range $18–22 with skew lower; risk‑reward favors underweight, with any approach to $21.50–22.00 a sell/short opportunity.
Quick Financial Overview
Olin Corporation is showing clear signs of strain in its current numbers. Q2 revenue came in at about $1.74B, slightly down year over year and below consensus, while EPS printed at -$0.12 versus expectations for +$0.10. That swing from an expected profit to an actual loss is the kind of surprise that forces traders to reset their near-term view on OLN.
Profitability ratios back up the story. Recent data show an EBIT margin of about -1.4% and a total profit margin near -2.9%, despite EBITDA of $170.2M on the quarter. On a trailing basis, revenue sits near $6.78B with a negative three-year growth rate, while price-to-sales around 0.31 and price-to-book near 1.22 tell you the market already prices in a lot of pessimism. The problem is earnings volatility and pressure on returns, with return on equity running negative in the latest twelve months.
Cash flow and leverage add another layer for OLN traders to watch. Operating cash flow for the recent quarter was only $7.9M against capital spending of $29M and dividends of $22.8M, leaving free cash flow clearly negative. Long-term debt sits above $3.3B and total debt-to-equity near 2.0, with interest coverage only about 2.3 times, so any further earnings hit matters. On the chart, OLN broke from the low-$22s down toward $18.73 on the weekly tape, and an intraday flush from roughly $20.48 to a low near $17.73 shows real selling pressure after earnings.
Conclusion
Olin Corporation now sits at the crossroad of weak fundamentals, cautious analyst calls, and heavy price damage. Q2 flipped from the expected profit to a meaningful loss, with revenue slippage and negative margins confirming that OLN is not just fighting the cycle, it is losing ground near term. When traders see both BMO Capital and Goldman Sachs marking targets down into the mid-$20s, it sends a clear message: upside expectations need to be kept in check.
From a trading standpoint, the recent slide from the $22 area to sub-$19 closes, plus an intraday spike down into the high-$17s, marks out a new risk zone. Any bounces in OLN now have to fight against overhead supply from trapped holders and a macro backdrop that still weighs on housing, autos, and commodity chemicals. At the same time, a low valuation base and long-term revenue scale mean sharp oversold rallies are always possible, but they are trades, not trends. As I teach my students, “You do not get paid for being early, you get paid for being right at the key levels, and with OLN those levels only matter if volume confirms the turn.” In that context, OLN is a textbook example of why clear conviction and defined edge are mandatory; as Tim Bohen, lead trainer with StocksToTrade says, “If you’re still guessing at the end of your analysis, it’s probably not a trade worth taking.” This is a name to treat as a tactical trading vehicle, not a comfort hold, for educational and research purposes only.
This is stock news, not investment advice. StocksToTrade News delivers real-time stock market updates tailored to highlight the key catalysts driving short-term price movements. Our coverage is designed for active traders and investors who thrive in fast-moving markets, with a focus on volatile sectors like penny stocks, AI stocks, Robinhood stocks and other momentum plays. From earnings reports and FDA approvals to mergers, new contracts, and unusual trading volume, we break down the events that can spark significant price action.
Looking to level up your trading game? Explore StocksToTrade, the ultimate platform for traders. With powerful tools designed for swing and day trading, integrated news scanning, and even social media monitoring, StocksToTrade keeps you one step ahead.
Check out our quick startup guide for new traders!
- How to Read Stock Charts: A Guide for Beginners
- Trading Plan: 6 Steps to Create One
- How To Create a Stock Watchlist
Ready to build your watchlists? Check out these curated lists:
Once your watchlist is set, take the next step and trade with confidence using StocksToTrade’s robust platform. Don’t miss out — grab your 14-day trial for just $7 and experience the edge you need to thrive in today’s fast-paced markets.