

Medical Properties Trust Inc. stocks have been trading down by -7.8 percent after debt, dividend, and tenant-risk concerns deepened investor pessimism.
Key Takeaways
- Price action in Medical Properties Trust Inc. shows a steady slide from roughly $3.20 in mid-October to near $2.00, putting MPT deep in penny-stock territory.
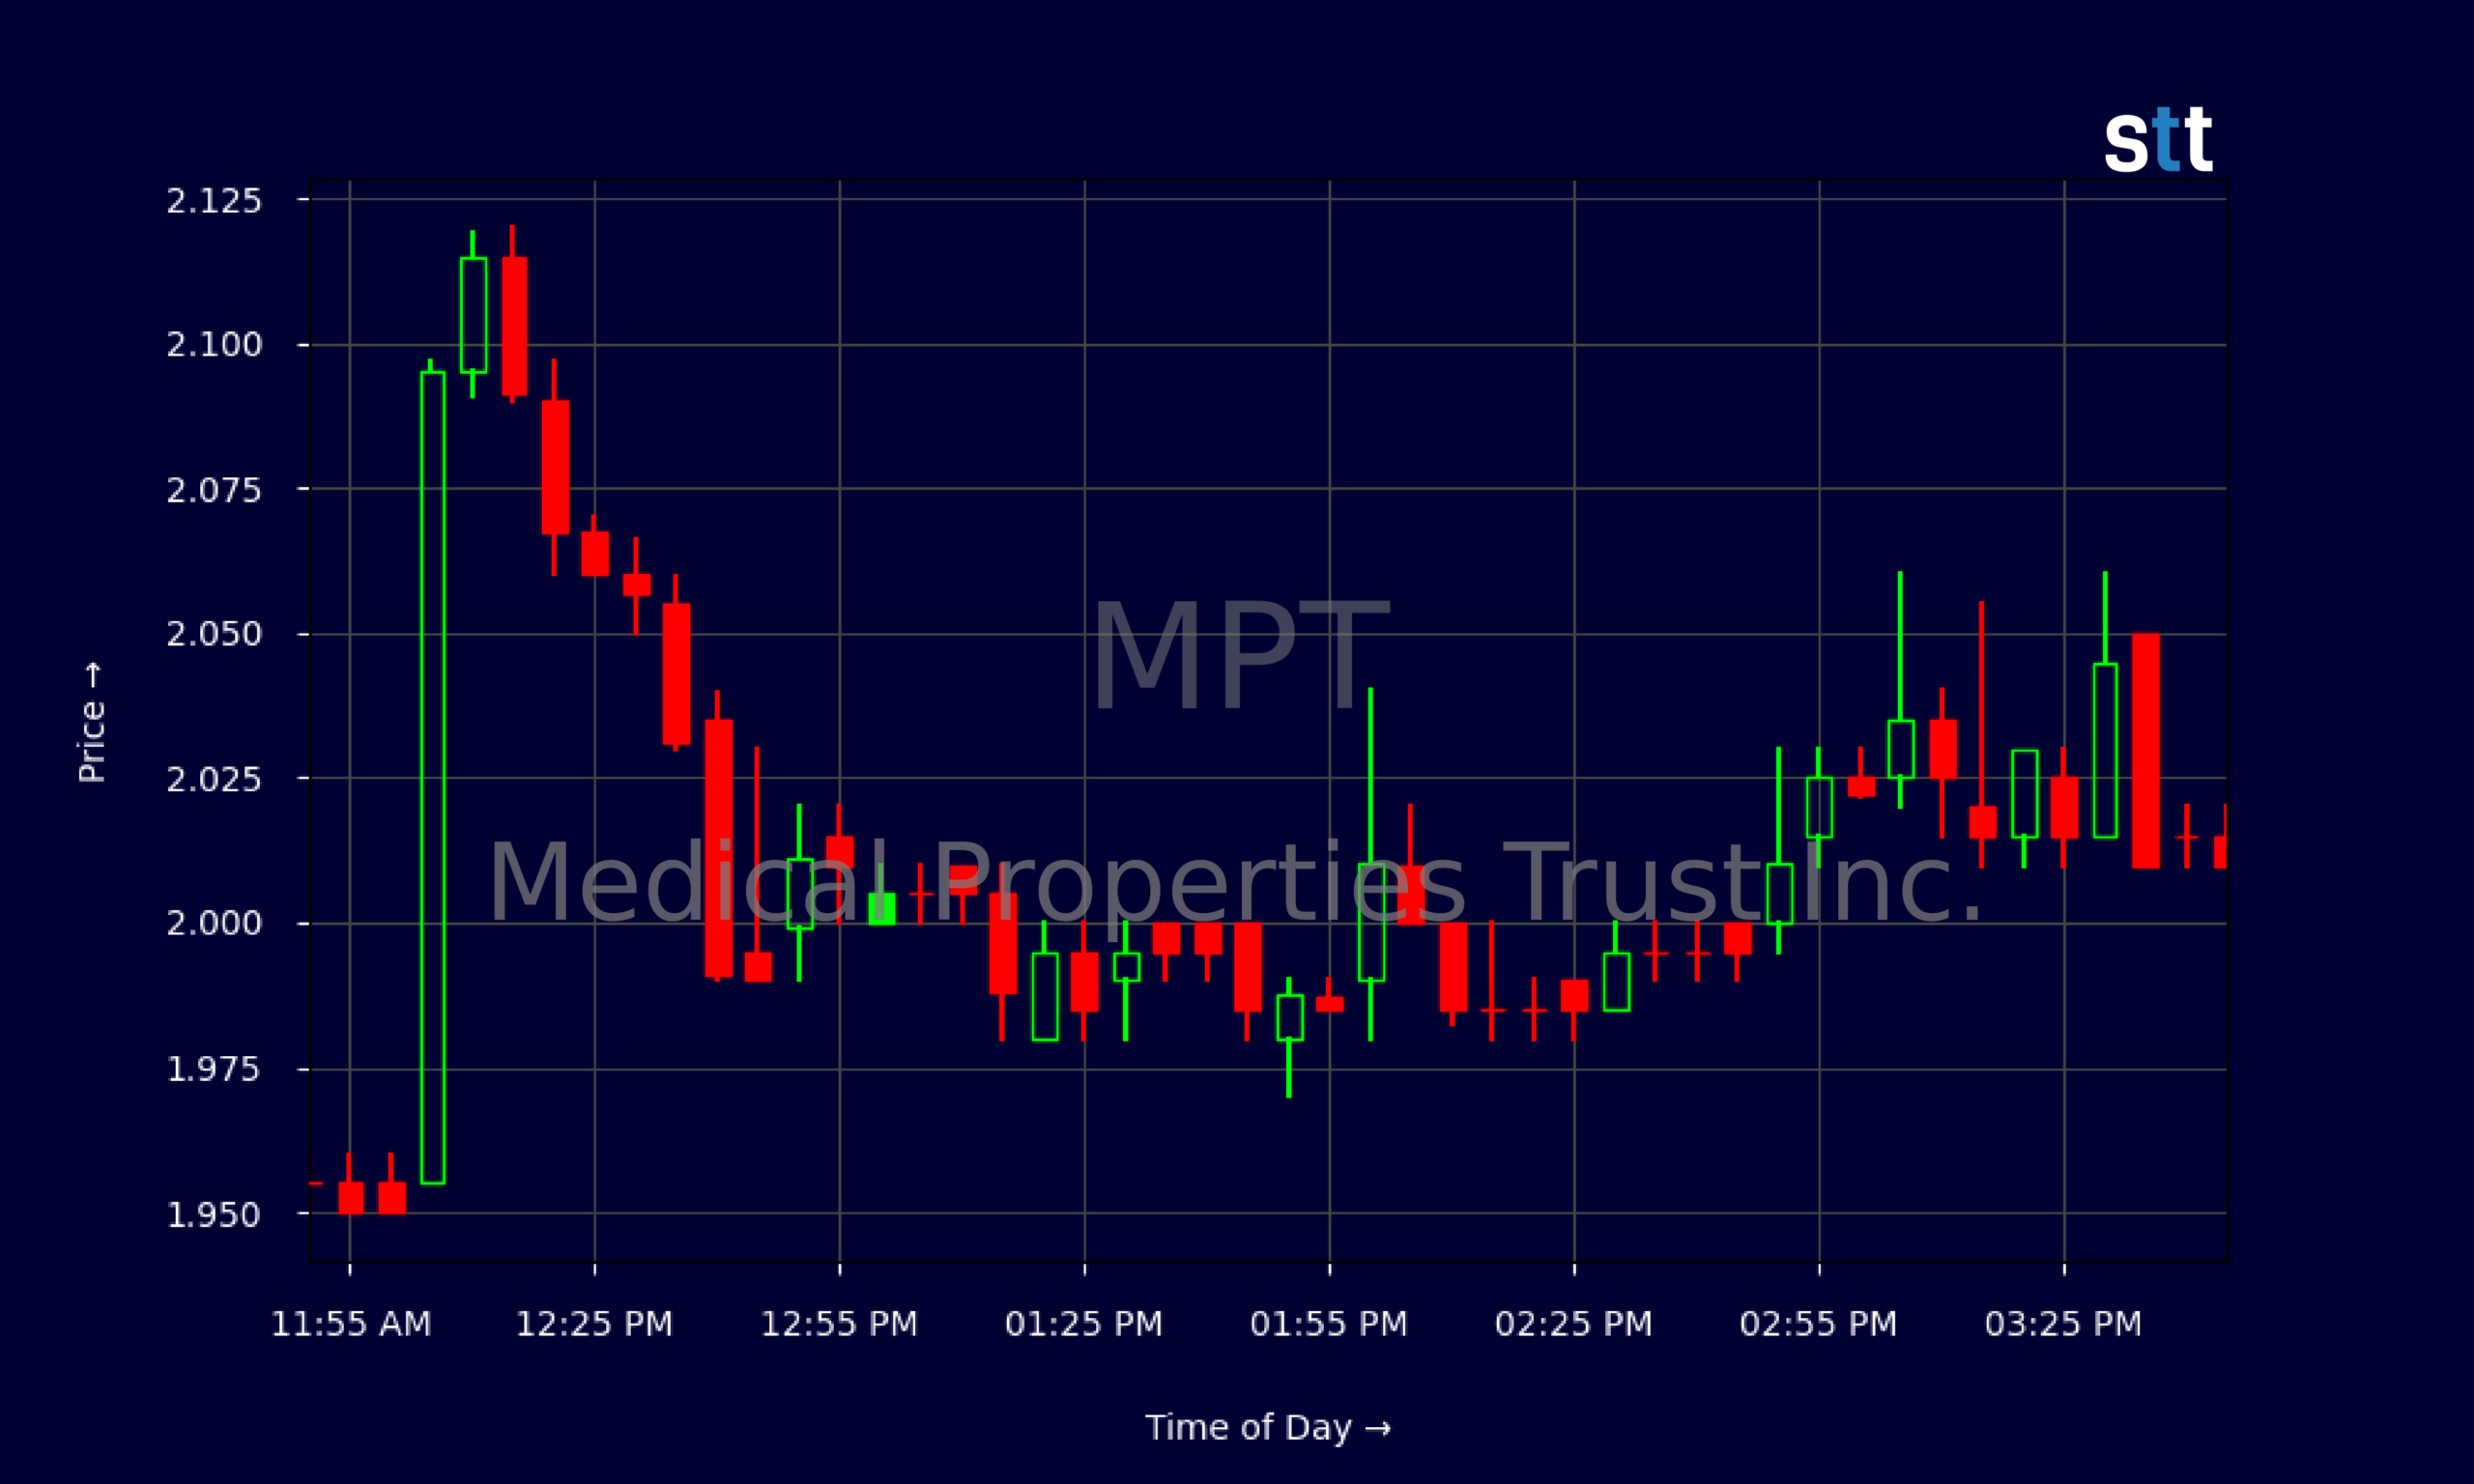
- Intraday trading in MPT clustered around $2.00 with tight 5-minute candles, signaling heavy consolidation and a possible base for the next trend move.
- Financials show MPT generating solid operating cash flow but carrying heavy debt, creating a classic high-risk, high-reward setup for active traders.
- Book value near $7.53 per share makes the current MPT price-to-book around 0.42, highlighting a steep discount that chart-focused traders often watch closely.
Live Update At 15:49:31 EST: On Tuesday, November 03, 2026 Medical Properties Trust Inc. stock [NYSE: MPT] is trending down by -7.8%! Discover the key drivers behind this movement as well as our expert analysis in the detailed breakdown below.
Quick Financial Overview
Medical Properties Trust Inc. sits in a strange spot. On paper, MPT still looks like a sizable real estate player, with about $14.7B in total assets and almost $4.5B in equity. Yet the stock trades near $2.00, which is less than half of stated book value. When a REIT like MPT trades around 0.42 times book, the market is saying it does not fully trust those assets, the earnings power, or the balance sheet risk.
Revenue over the last year is just under $1.0B, but those revenues have been shrinking over three and five years. Margins look oddly mixed: massive gross margin above 90%, but negative net profit margin thanks to heavy non-cash charges and big interest expense. For traders, that screams “financial engineering and debt overhang.”
More Breaking News
- GRAB Stock Surges As Q3 Earnings Beat Fuels Momentum
- WULF Stock Climbs As AI Data-Center Funding Fears Grow
- Intel Stock Plunges As Weak Outlook Triggers Legal Scrutiny
- Grab Holdings Falls 1% Today
The latest quarterly numbers for MPT show a tiny net loss, roughly flat at the EPS line, but strong EBITDA and operating income. Importantly, MPT still throws off over $62M in quarterly operating cash flow and about the same in free cash flow while paying cash dividends. That cash supports trading liquidity and keeps value-focused traders glued to the tape, even as the stock grinds lower.
Why Traders Are Watching MPT’s Price Compression
Look at the daily chart and you see exactly why MPT is on so many screens. In early October, Medical Properties Trust Inc. was closing around $3.10–$3.20. Over the next few weeks, MPT bled lower, breaking under $3.00, then $2.80, then $2.50, and finally touching the low $2.00s. By the latest session, it printed a $2.01 close after testing as low as $1.95. That is a brutal downtrend, but also the kind of sustained pressure that eventually forces a bounce or a breakdown.
Zoom into the 5‑minute chart and the story sharpens. MPT opened near $2.15, popped toward $2.19, then sold off steadily through mid-day, bottoming around $1.95. After that flush, Medical Properties Trust Inc. started grinding sideways. Most candles sat between roughly $1.98 and $2.03, with multiple failed pushes above $2.05. That intraday consolidation around $2.00 is where short-term traders tend to battle.
For momentum traders, MPT now lines up as a classic compression play. If Medical Properties Trust Inc. can reclaim and hold above ~$2.10 with volume, you have room toward prior resistance in the $2.40–$2.80 range. If $1.95 breaks decisively, the chart opens up for another leg lower and more panic selling. Added to that, the huge gap between price and book value gives MPT a built-in narrative: is this a deep value trap or a coiled spring? That tension attracts day traders and swing traders who thrive on volatility, tight risk levels, and clear technical lines.
Conclusion
Medical Properties Trust Inc. is not trading like a sleepy REIT. MPT is acting like a distressed value name with a leveraged balance sheet and a chart that has lost the crowd’s trust. Debt-to-equity above 2.0 and interest coverage around 1x tell you leverage is real here. At the same time, a current ratio near 3.0, hundreds of millions in cash, and consistent operating cash flow mean MPT is still in the game for now.
For active traders, that mix sets up a very binary feel. Medical Properties Trust Inc. trades near $2.00 while sporting book value over $7.00 and a fat stated dividend yield, but the long downtrend warns that the market still expects more pain or dilution. The key for short-term setups is price, volume, and those tight intraday levels around $1.95 support and $2.10 resistance. In this kind of choppy, emotional tape, discipline matters; as Tim Bohen, lead trainer with StocksToTrade says, “I never chase price. The best opportunities allow me to enter on my terms, not when I’m feeling pressured.” That mindset is especially relevant when a beaten-down chart like MPT starts to spike or fade around key levels.
This is exactly the kind of broken chart Tim Sykes talks about when he says, “The market doesn’t lie — when a stock gets crushed, you respect the price action first and ask questions later.” Traders studying MPT need to do just that: ignore the story hype, map the chart, understand the debt risk, and trade the levels with tight risk controls. This article is for educational and research purposes only and is not investment advice.
This is stock news, not investment advice. StocksToTrade News delivers real-time stock market updates tailored to highlight the key catalysts driving short-term price movements. Our coverage is designed for active traders and investors who thrive in fast-moving markets, with a focus on volatile sectors like penny stocks, AI stocks, Robinhood stocks and other momentum plays. From earnings reports and FDA approvals to mergers, new contracts, and unusual trading volume, we break down the events that can spark significant price action.
Looking to level up your trading game? Explore StocksToTrade, the ultimate platform for traders. With powerful tools designed for swing and day trading, integrated news scanning, and even social media monitoring, StocksToTrade keeps you one step ahead.
Check out our quick startup guide for new traders!
- How to Read Stock Charts: A Guide for Beginners
- Trading Plan: 6 Steps to Create One
- How To Create a Stock Watchlist
Ready to build your watchlists? Check out these curated lists:
Once your watchlist is set, take the next step and trade with confidence using StocksToTrade’s robust platform. Don’t miss out — grab your 14-day trial for just $7 and experience the edge you need to thrive in today’s fast-paced markets.