

Medical Properties Trust Inc. stocks have been trading down by -7.91 percent after bearish analyst downgrades and heightened balance-sheet concerns.
Key Takeaways
- Shares of Medical Properties Trust Inc. have fallen from above $3.30 to about $2.25 this month, putting MPT in a clear downtrend on the daily chart.
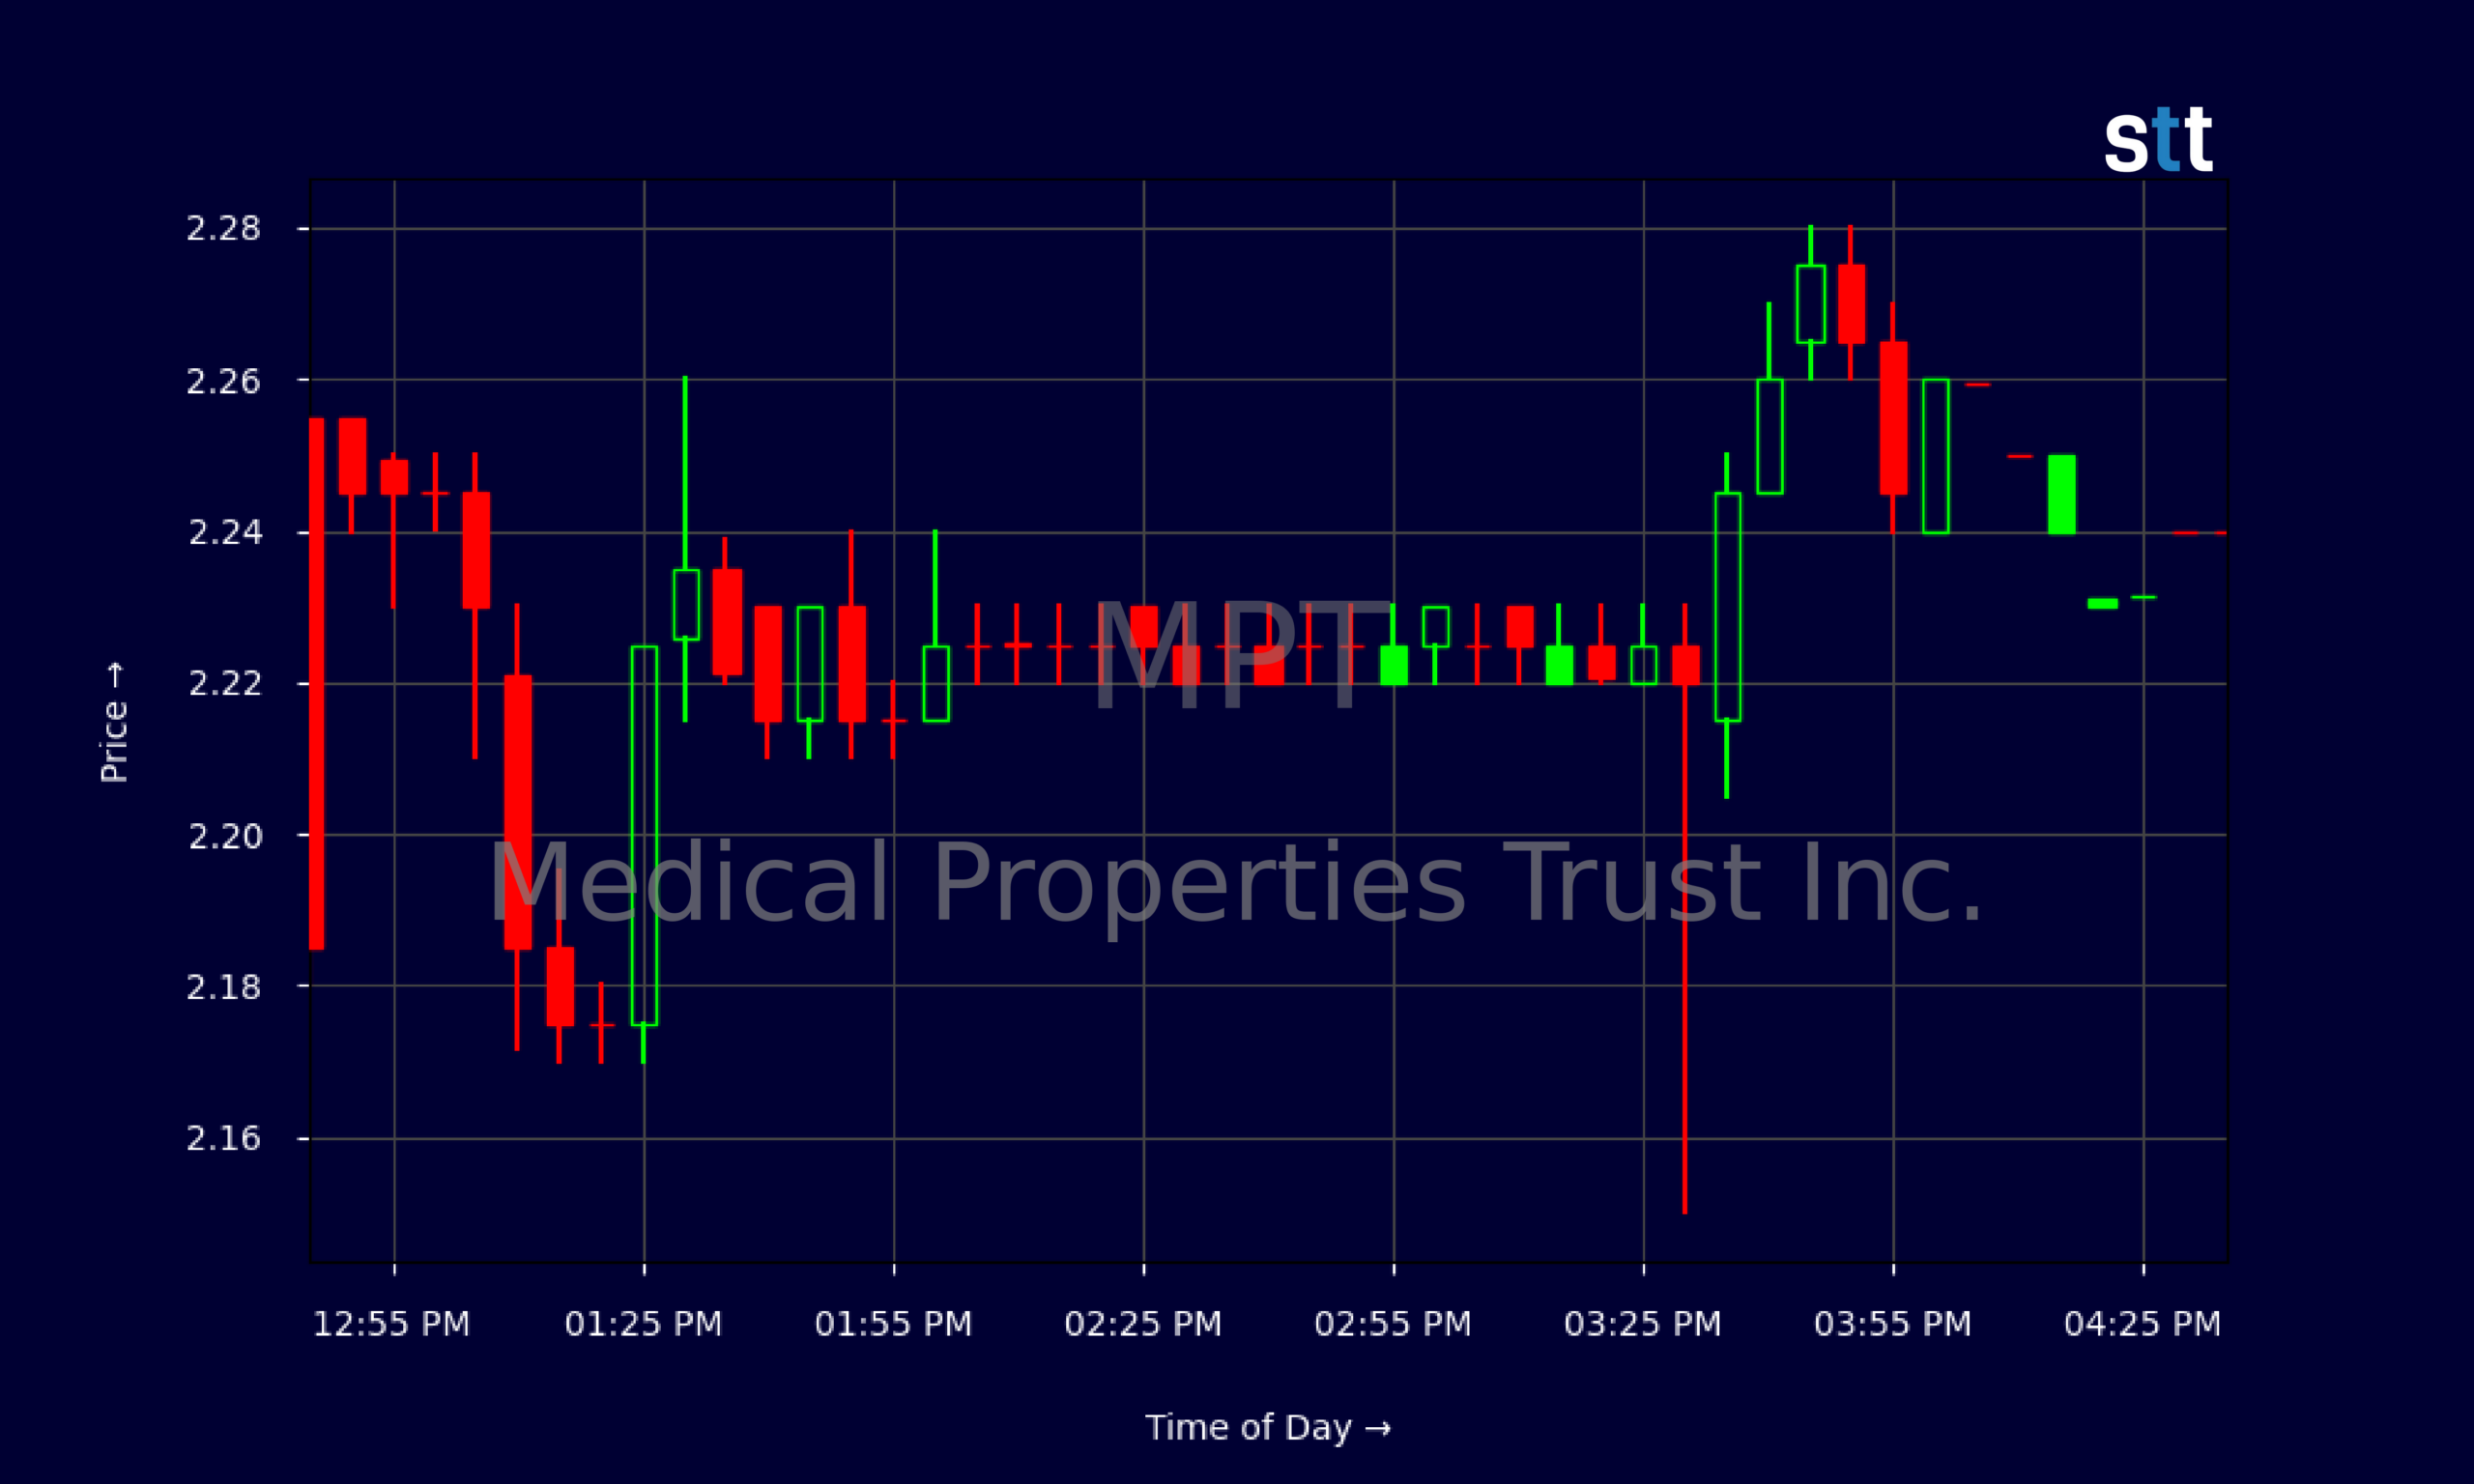
- Intraday trading in MPT shows tight consolidation around $2.20–$2.28, signaling a tug-of-war between dip buyers and sellers unloading into strength.
- The latest report shows roughly $14.7B in assets and heavy leverage, with total debt more than double equity, a key risk for MPT traders.
- MPT is still paying a rich cash dividend, but negative net income and high interest costs raise questions about how long that payout pace can last.
Live Update At 16:47:58 EDT: On Friday, October 30, 2026 Medical Properties Trust Inc. stock [NYSE: MPT] is trending down by -7.91%! Discover the key drivers behind this movement as well as our expert analysis in the detailed breakdown below.
Quick Financial Overview
Medical Properties Trust Inc. is trading like a classic troubled high‑yield REIT. The chart tells the story first. Earlier in the month, MPT was closing near $3.30. Now the stock is finishing days around $2.25. That’s a roughly 30% slide in a few weeks, a big move for a REIT and a clear warning sign for traders.
On the fundamentals, MPT generated about $259.3M in quarterly revenue and roughly $972.0M over the trailing year, but profitability is under pressure. Profit margins on a GAAP basis are negative, even though the gross margin is an eye‑popping 97.2%. That gap comes from heavy interest expense and write‑downs. MPT reported net income of about -$2.6M last quarter and pretax profit margins deeply in the red.
More Breaking News
- AVGO Stock Holds High Ground As Broadcom Cash Machine Powers On
- MEOH Stock Jumps As Earnings Beat Fuels Buyback Momentum
- BTG Stock Pulls Back As Charts Flash Key Support
- Micron Stock Slides As China’s CXMT DRAM Threat Rattles Traders
Leverage is the major theme. Total assets sit around $14.75B while total liabilities are about $10.25B. Debt‑to‑equity is 2.19, and interest coverage is only about 1x. MPT does throw off cash — operating cash flow was about $62.4M and free cash flow was positive — but a big chunk gets eaten by debt service and dividends. For traders, that mix of high yield, high debt, and shrinking price creates both opportunity and serious downside risk.
Why Traders Are Watching MPT’s Price Slide
MPT is moving like a battleground name, and that always attracts active traders. On the daily chart, Medical Properties Trust Inc. has bled lower from the mid‑$3s to the low‑$2s. Each bounce has been sold. Closes stepping down from $3.30 to $3.01, then to $2.85, $2.74, $2.63, and now $2.25 show a persistent series of lower highs and lower lows. That’s textbook downtrend behavior.
Zoom into the intraday tape and you see the fight. MPT opened near $2.39 and quickly pushed down, with an early flush under $2.16 before grinding back toward $2.25. Most of the day, Medical Properties Trust Inc. traded in a tight band between $2.21 and $2.28. That kind of range action after a big prior drop often signals short‑term consolidation. Shorts lock in gains, and bottom fishers try to scalp a bounce.
Underneath that price action, the balance sheet explains why MPT stays on so many watchlists. Medical Properties Trust Inc. holds around $396.6M in cash and $14.75B in total assets, but it also carries about $8.99B in long‑term debt and another $719M in current debt. Leverage ratio is above 3x, and long‑term debt makes up roughly 69% of capital.
For traders, that means any change in credit conditions, rates, or asset values can swing sentiment on MPT hard in either direction. Add a dividend yield near 15% at current prices — supported by a $0.09 per‑share quarterly payout despite recent losses — and Medical Properties Trust Inc. becomes a prime candidate for short squeezes, dividend‑cut rumors, and high‑volatility moves.
Conclusion
MPT is a classic high‑risk, high‑reward story wrapped in a REIT package. The price trend is undeniably bearish: Medical Properties Trust Inc. has broken down from the low‑$3s toward the low‑$2s, and every bounce so far has been capped quickly. On the tape, MPT shows intraday support building around $2.15–$2.20, but sellers still show up above $2.25–$2.30. Until Medical Properties Trust Inc. can reclaim prior resistance zones, traders need to treat this as a broken chart, not a safe yield play.
Fundamentals line up with that cautious read. MPT’s revenues are sizable, and EBITDA of roughly $230.2M shows the core portfolio can produce cash. But heavy debt, thin interest coverage, and negative net income put Medical Properties Trust Inc. under pressure. The dividend remains attractive on paper, yet the math forces serious questions about sustainability if conditions don’t improve.
For active traders, that tension is the whole opportunity. As Tim Sykes loves to say, “Patterns repeat, but you have to do the work to recognize them and react fast.” That ties in well with another trading mindset: As Tim Bohen, lead trainer with StocksToTrade says, “Preparation is half the trade. By the time the bell rings, my decisions are nearly made.” With MPT, the pattern is clear: leveraged balance sheet, sliding stock, fat yield, and a chart searching for a real bottom. This content is for educational and research purposes only, but traders studying Medical Properties Trust Inc. should focus on the levels, the debt load, and the cash flow trends before making any trading decision.
This is stock news, not investment advice. StocksToTrade News delivers real-time stock market updates tailored to highlight the key catalysts driving short-term price movements. Our coverage is designed for active traders and investors who thrive in fast-moving markets, with a focus on volatile sectors like penny stocks, AI stocks, Robinhood stocks and other momentum plays. From earnings reports and FDA approvals to mergers, new contracts, and unusual trading volume, we break down the events that can spark significant price action.
Looking to level up your trading game? Explore StocksToTrade, the ultimate platform for traders. With powerful tools designed for swing and day trading, integrated news scanning, and even social media monitoring, StocksToTrade keeps you one step ahead.
Check out our quick startup guide for new traders!
- How to Read Stock Charts: A Guide for Beginners
- Trading Plan: 6 Steps to Create One
- How To Create a Stock Watchlist
Ready to build your watchlists? Check out these curated lists:
Once your watchlist is set, take the next step and trade with confidence using StocksToTrade’s robust platform. Don’t miss out — grab your 14-day trial for just $7 and experience the edge you need to thrive in today’s fast-paced markets.