

Leverage Shares 2X Long SPCX Daily ETF faces intensified selling pressure as SPAC-related sentiment sours, and stocks have been trading down by -11.18 percent.
Key Takeaways
- Leverage Shares 2X Long SPCX Daily ETF has dropped from above $12 to the mid-$8s, signaling a sharp momentum shift on the daily chart.
- Recent SPCH candles show heavy intraday swings, with wide ranges suggesting active short‑term trading and algorithmic activity.
- Key support appears to be forming in the high‑$7s to low‑$8s, an area where SPCH has bounced multiple times.
- With no earnings or dividends to track, traders in SPCH must rely heavily on price action, leverage mechanics, and sector sentiment.
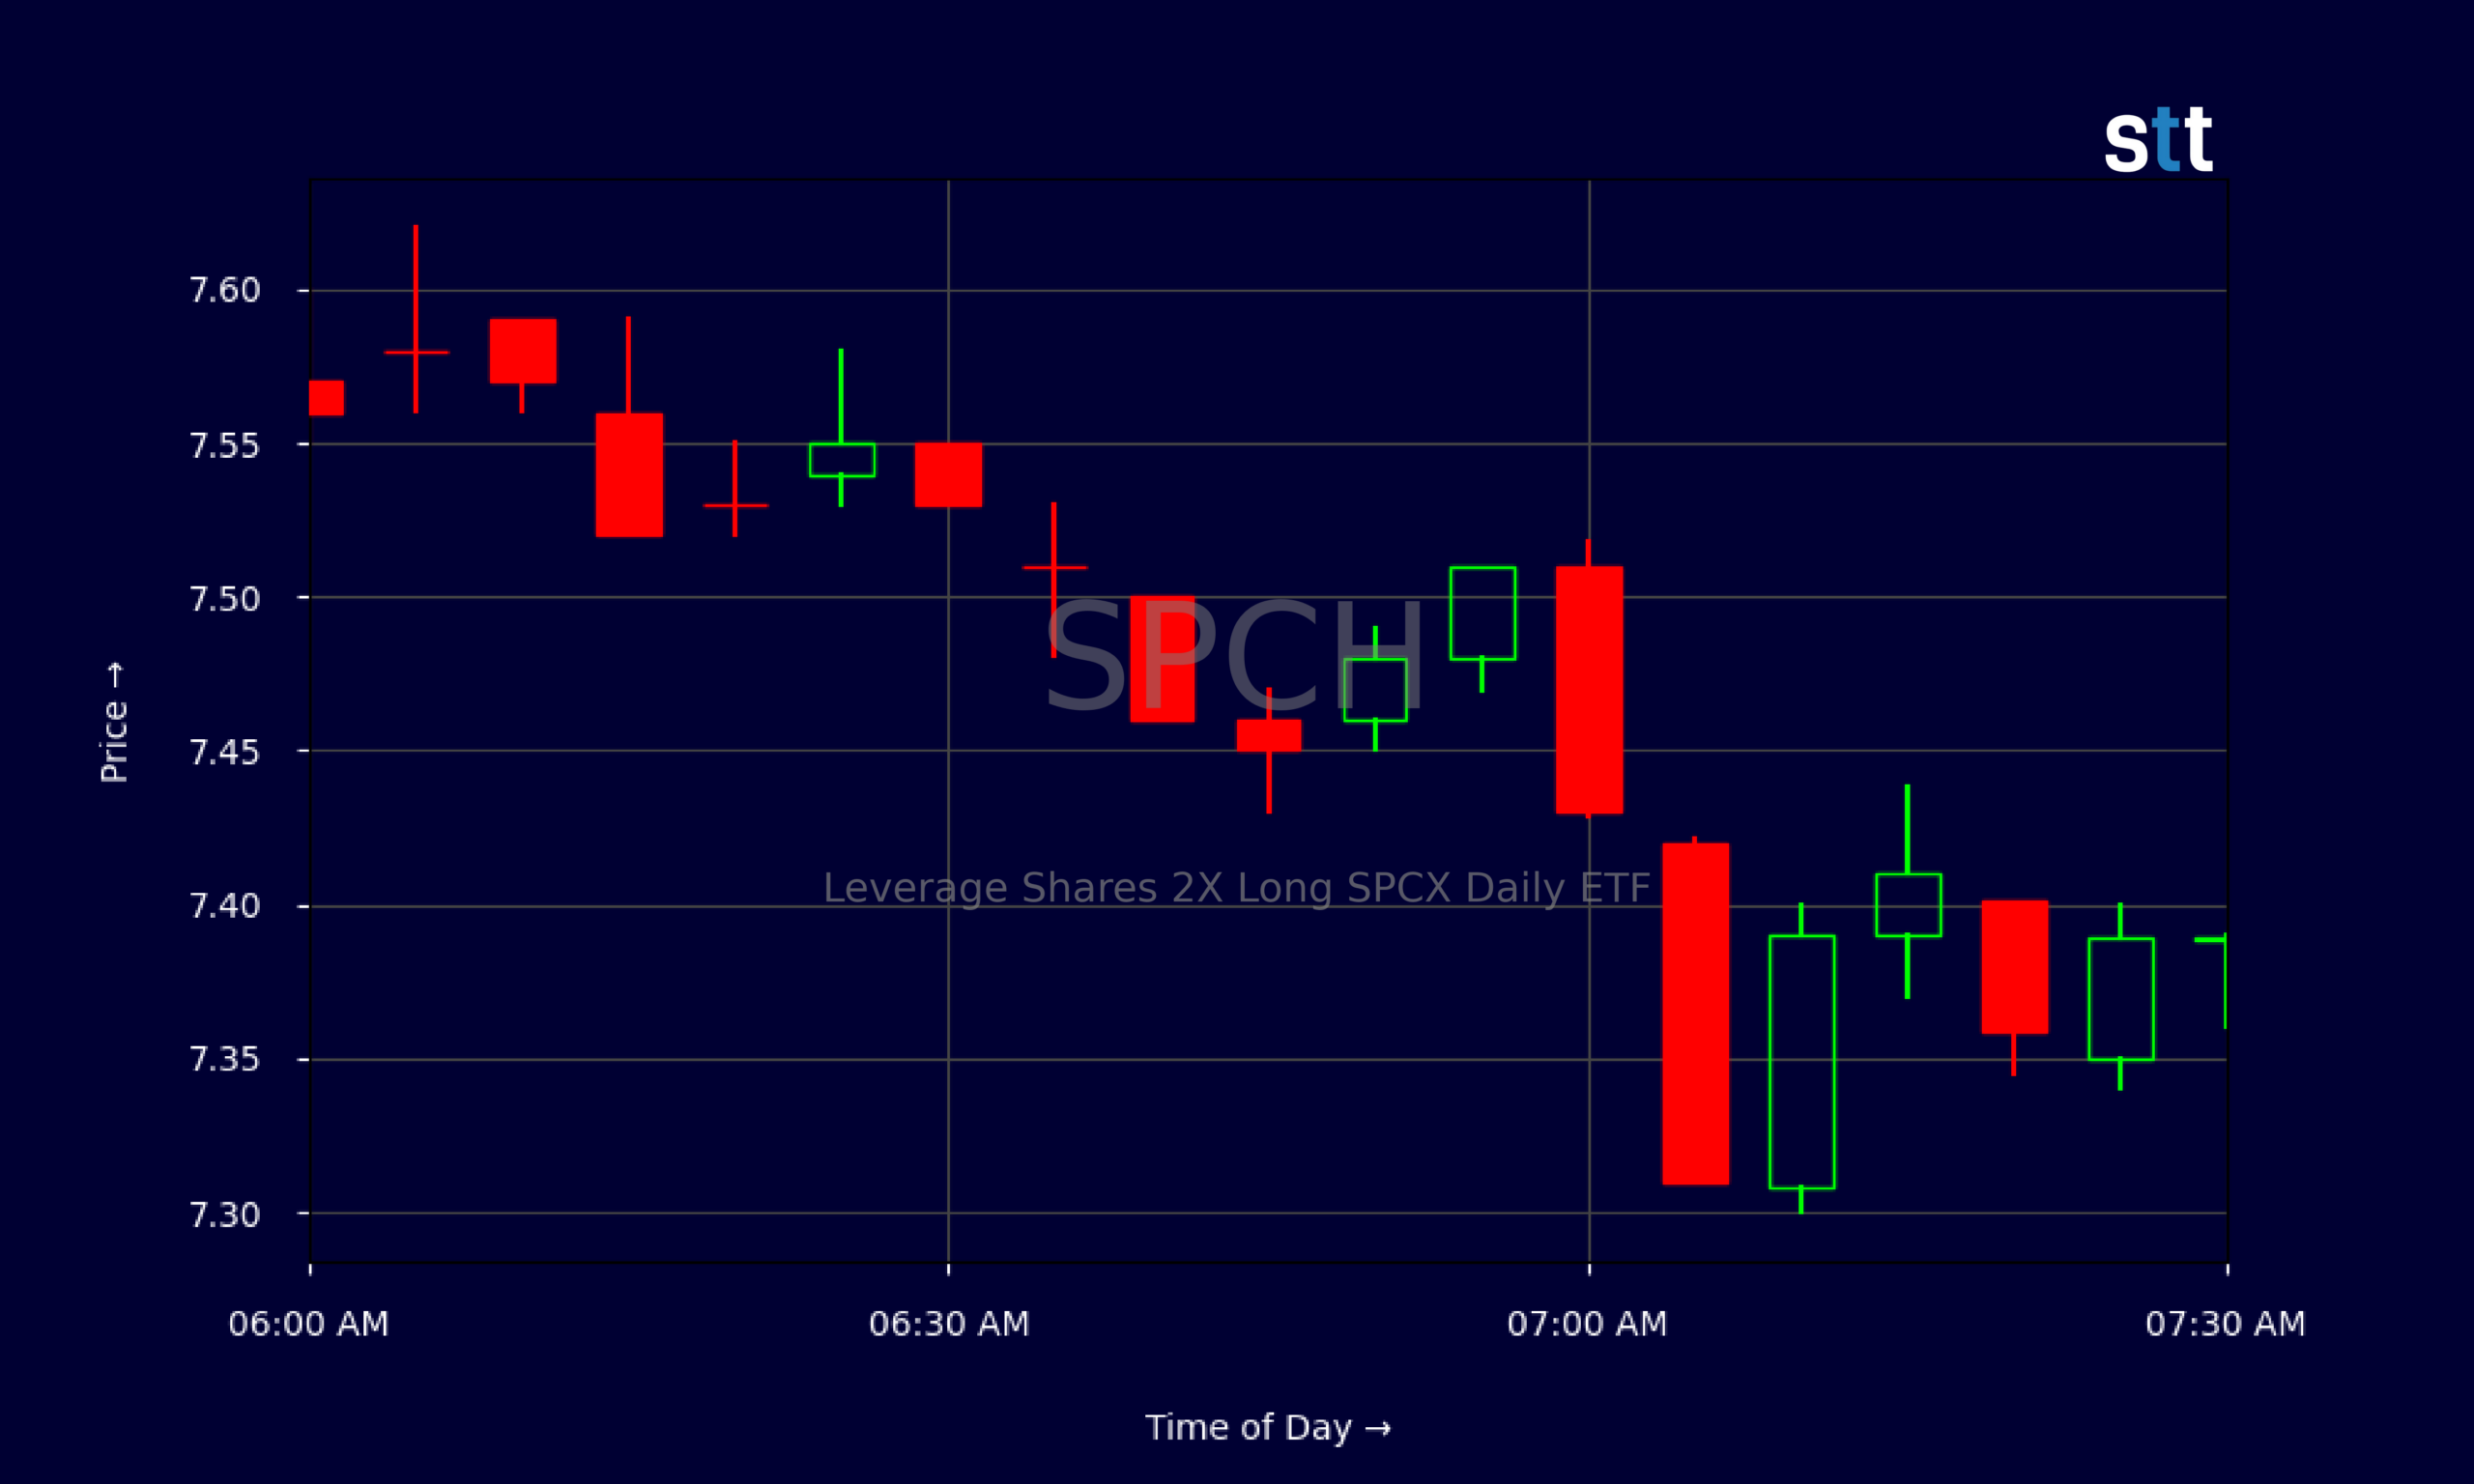
Live Update At 07:33:43 EST: On Wednesday, November 04, 2026 Leverage Shares 2X Long SPCX Daily ETF stock [BATS Global Markets: SPCH] is trending down by -11.18%! Discover the key drivers behind this movement as well as our expert analysis in the detailed breakdown below.
Quick Financial Overview
Leverage Shares 2X Long SPCX Daily ETF, trading under ticker SPCH, is a leveraged product, not a traditional operating company. That means there are no classic income statements, margins, or earnings trends to lean on. The key “financial” driver is its mandate: deliver roughly 2x the daily performance of its underlying SPCX exposure. For traders, that leverage cuts both ways.
On the recent daily chart, SPCH ran from around $11.78 on 2026/10/12 to a high near $12.09 the same day, then started a steady slide. Over the following weeks, SPCH faded into the $8s, with closes like $10.60 on 2026/10/13, then $10.02, $9.53, and eventually down to $8.32 by 2026/11/03. That’s a sizable drawdown in a short stretch.
More Breaking News
- BitMine Immersion Technologies Falls 2% Today
- NOK Stock Slides As Traders Question Rally After Earnings
- NU Stock Draws Bullish Targets Amid Political Jitters
- SNAP Stock Slips As User Miss, Regulation Weigh On Outlook
Because key ratios such as P/E, price‑to‑book, or debt metrics are essentially blank for SPCH, traders must treat it primarily as a leveraged trading vehicle. The ETF’s performance reflects both its underlying holdings and compounding effects from daily rebalancing. In choppy markets, that can slowly eat away at value even without a clear trend. Understanding that drag is critical for anyone trading SPCH beyond quick swings.
Why Traders Are Watching SPCH Price Action
SPCH has been putting on a clinic in how leveraged ETFs behave during a trend break. Earlier in October, SPCH printed strong closes above $11, with sessions like 2026/10/12 and 2026/10/13 showing strong intraday highs over $11 and $12. That kind of action attracts momentum traders quickly. But the follow‑through didn’t last. Once SPCH lost the $11 area, sellers stepped in hard, driving it down through $10 and then $9.
Look at the sequence: after tagging $11.78–$12.09 on 2026/10/12, SPCH later closed at $10.60 on 2026/10/13, then $10.02 on 2026/10/14. By 2026/10/21, the ETF touched $11.72 intraday but closed much lower at $10.84, showing overhead pressure. Each bounce got sold faster. That pattern usually tells traders smart money is unloading into strength.
More recently, SPCH has bounced around between $7.59 and $8.88, a clear downshift in range. The close at $8.32 on 2026/11/03, after a high of $8.49, shows buyers trying to stabilize, but not yet in full control. Intraday, the 5‑minute chart around the $7.30–$7.60 band shows a tug‑of‑war. You see prints like $7.51 down to $7.31, then back toward $7.57 and $7.59. That back‑and‑forth reflects short scalps, tight risk control, and reactive trading rather than big conviction.
For active traders, this is where SPCH gets interesting. Leverage plus volatility plus a defined range can set up clean day trades. But anyone holding SPCH too long, hoping for a straight‑line recovery, is battling both trend and the daily reset math.
Conclusion
Right now, SPCH sits well below its October highs, but not in freefall. The recent action around $8 suggests Leverage Shares 2X Long SPCX Daily ETF is trying to carve out a base after a multi‑week slide. For traders, the key is not guessing a long‑term “fair value” for SPCH. The edge lies in reading supply and demand on the chart. As Tim Bohen, lead trainer with StocksToTrade says, “The best way to learn is by tracking trades, wins, losses, and lessons learned. Every trade has something to teach.” — a mindset that helps traders stay focused on process, not predictions.
If SPCH can hold above the recent lows near $7.50 and reclaim the $9 area with volume, short‑term momentum traders will likely swarm back in. If it cracks that $7.50 zone, the next leg down in this leveraged ETF can be fast and unforgiving. That is the nature of products like SPCH — they reward discipline and punish stubbornness.
Tim Sykes says it best: “The market doesn’t care about your opinion, only your discipline.” For anyone trading SPCH, that means cutting losses quickly, respecting the leverage, and letting the chart, not hope, dictate the plan. Use SPCH as a tool for tactical trades, not a long‑term comfort blanket. This analysis is for educational and research purposes only, to help traders better understand how SPCH moves and where the real risk sits.
This is stock news, not investment advice. StocksToTrade News delivers real-time stock market updates tailored to highlight the key catalysts driving short-term price movements. Our coverage is designed for active traders and investors who thrive in fast-moving markets, with a focus on volatile sectors like penny stocks, AI stocks, Robinhood stocks and other momentum plays. From earnings reports and FDA approvals to mergers, new contracts, and unusual trading volume, we break down the events that can spark significant price action.
Looking to level up your trading game? Explore StocksToTrade, the ultimate platform for traders. With powerful tools designed for swing and day trading, integrated news scanning, and even social media monitoring, StocksToTrade keeps you one step ahead.
Check out our quick startup guide for new traders!
- How to Read Stock Charts: A Guide for Beginners
- Trading Plan: 6 Steps to Create One
- How To Create a Stock Watchlist
Ready to build your watchlists? Check out these curated lists:
Once your watchlist is set, take the next step and trade with confidence using StocksToTrade’s robust platform. Don’t miss out — grab your 14-day trial for just $7 and experience the edge you need to thrive in today’s fast-paced markets.