

Leverage Shares 2X Long SNDK Daily ETF faces pressure as negative sentiment deepens, and stocks have been trading down by -17.8 percent.
Key Takeaways
- Leverage Shares 2X Long SNDK Daily ETF has broken down from its recent $10 area, now trading almost half that level as volatility ramps up.
- Recent SNDG daily candles show sharp intraday swings, a classic warning that late chasers are getting trapped.
- Intraday SNDG chart action around $4–$5 suggests early premarket liquidity but weak follow-through so far.
- With no clear fundamental metrics, SNDG trades like a pure leveraged momentum vehicle tied to Sandisk exposure.
- Active traders are stalking key support and resistance zones for short-term bounces and quick flips in SNDG.
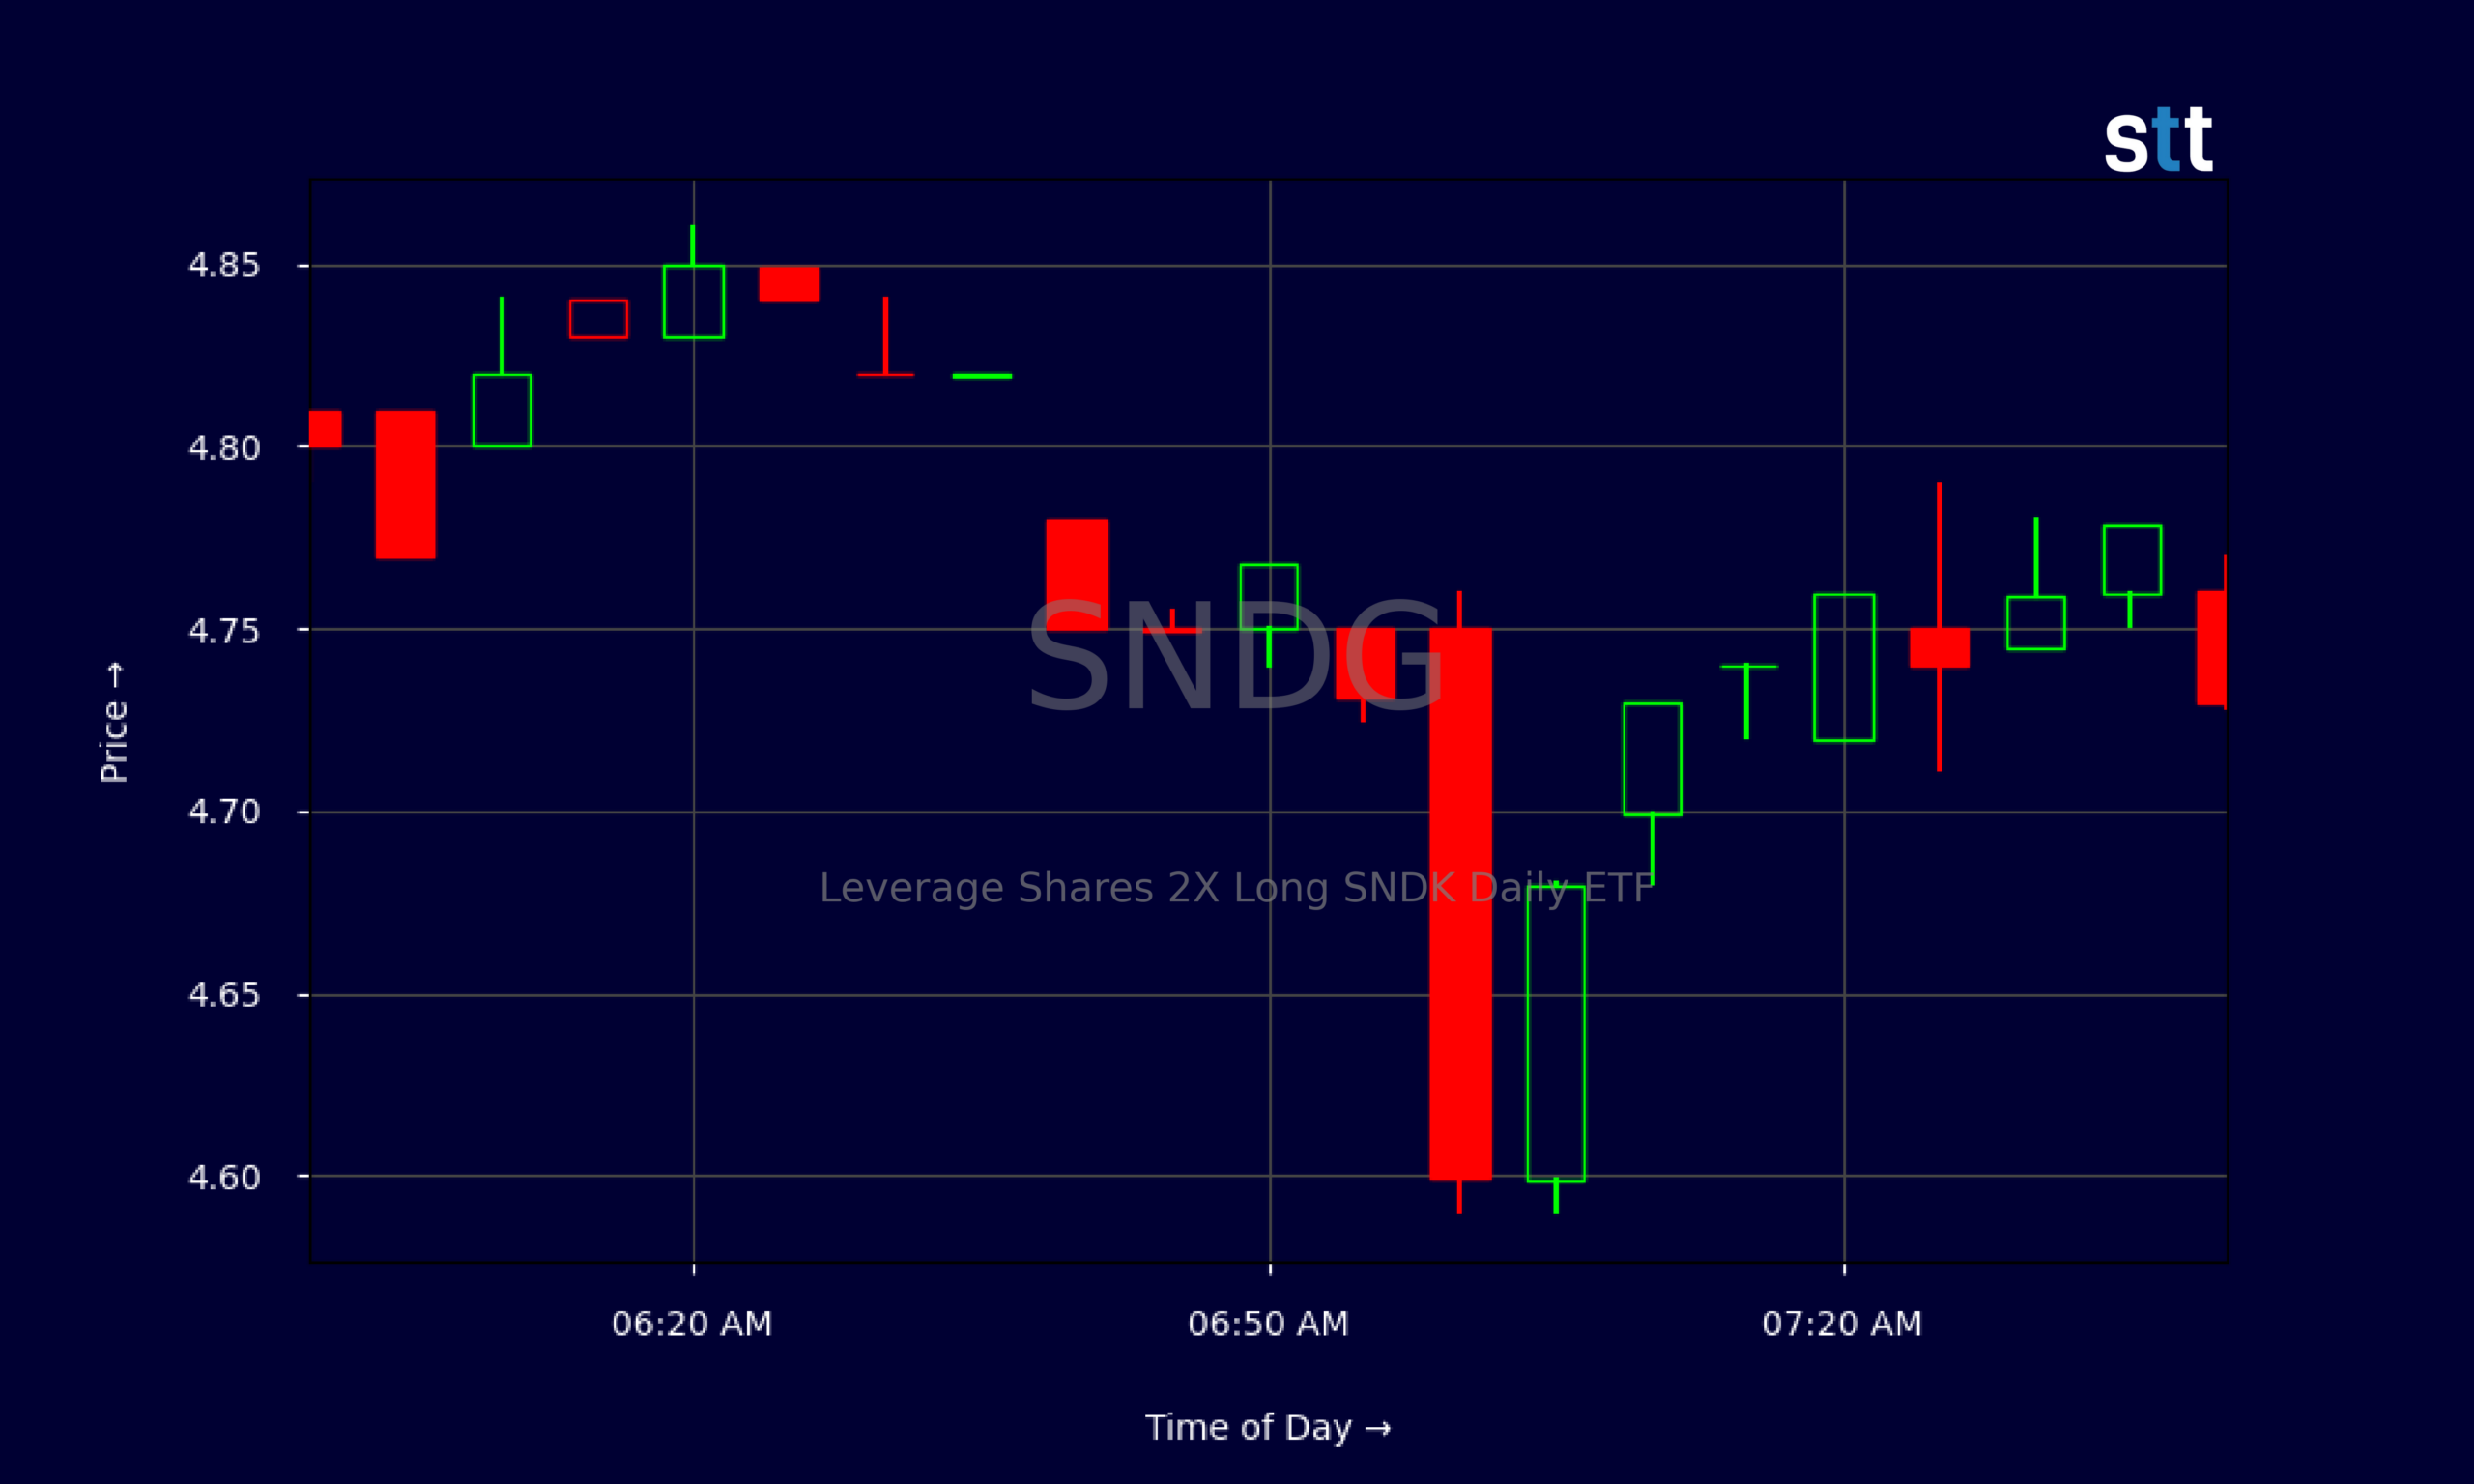
Live Update At 07:47:52 EDT: On Friday, October 30, 2026 Leverage Shares 2X Long SNDK Daily ETF stock [BATS Global Markets: SNDG] is trending down by -17.8%! Discover the key drivers behind this movement as well as our expert analysis in the detailed breakdown below.
Quick Financial Overview
SNDG, the Leverage Shares 2X Long SNDK Daily ETF, is built for traders who want amplified exposure, not quiet compounding. The daily chart shows exactly that. In early October, SNDG was trading near $10, with prints like $10.13 open and $9.90 close. Since then, the ETF has steadily bled lower, with recent closes in the mid-$5 range and premarket prints even lower.
For traders, that slide in SNDG means anyone buying strength without a plan is getting punished. The 2X leverage magnifies every move in the underlying Sandisk exposure, so a normal pullback turns into a sharp drawdown on this ETF. Key ratio data for SNDG is basically blank, which fits an ETF that tracks and amplifies price action rather than operations or earnings.
More Breaking News
- NUWE Stock Rockets As Pediatric Strategy Grabs Trader Attention
- NRXP Stock Eyes FDA Catalyst As Ketamine Momentum Builds
- OWL Stock Jumps As Sale Talk And AI Deals Stir Momentum
- NCLH Stock Holds Support As Wall Street Trims Cruise Targets
Intraday, SNDG’s 5‑minute candles between roughly $4.60 and $4.85 show tight ranges but frequent wicks. That kind of tape tells traders there is active scalping, but no committed trend yet. For SNDG, the numbers say this is a technical trader’s playground, not a fundamentals story. Risk and reward are both dialed up.
Why Traders Are Watching SNDG’s Volatility
SNDG has one job: give traders a leveraged way to play Sandisk’s moves. The recent chart shows what happens when that leverage cuts the wrong way. From an October high near $10.35 to a recent close around $5.73, SNDG has essentially been sliced in half in a few weeks. That’s not a quiet drift; that’s a momentum unwind.
Look at the daily candles. Around 2026/10/07, SNDG printed a high over $10 but closed near $9.73. A few sessions later, the ETF slipped under $8.50. By 2026/10/29, it was struggling to hold the mid‑$5s. Each bounce is getting weaker. That stair-step pattern tells traders that dip buyers are losing control and shorts or profit-takers are leaning on every pop.
The intraday SNDG tape confirms it. Premarket action around 06:00–07:45 shows repeated tests of the low‑$4s and mid‑$4s, with quick spikes that fail. SNDG pops toward $4.84–$4.86, then slides back under $4.75. That’s textbook choppy action where chasing breakouts gets punished and only disciplined scalpers survive.
For active traders, SNDG’s appeal is exactly this volatility. The ETF’s 2X structure means small shifts in the underlying can create attractive intraday ranges. But SNDG also demands respect. Tight risk, clear levels, and quick decision-making are mandatory. It’s not a “set it and forget it” product; it’s a short-term trading tool.
Conclusion
SNDG is telling a clear story on the chart. The Leverage Shares 2X Long SNDK Daily ETF ran hot near $10, then lost momentum and started a firm downtrend toward the mid‑$5s and even the $4s in premarket trading. That slide, matched with shrinking bounces, says traders are more focused on selling strength than buying dips right now.
For short-term players, that doesn’t mean SNDG is “done.” It means you treat it like the leveraged product it is. Build a trading plan around clear support and resistance. Respect the trend until it convincingly breaks. Watch how SNDG reacts around prior lows and prior bounce zones; that’s where the best risk/reward often appears. This is also where your tracking and review process matters. As Tim Bohen, lead trainer with StocksToTrade says, “The best way to learn is by tracking trades, wins, losses, and lessons learned. Every trade has something to teach.” Keeping detailed records of how you trade SNDG can help you refine your edge over time.
SNDG will continue to attract traders who want amplified moves off Sandisk price action. The lack of traditional financial ratios just reinforces that SNDG is a technical instrument first, a fundamentals story never. As Tim Sykes likes to remind his students, “Patterns repeat, but you have to be prepared to strike quickly and cut losses even quicker.” For anyone watching SNDG, that mindset is non‑negotiable. This ETF rewards discipline and punishes hope.
This is stock news, not investment advice. StocksToTrade News delivers real-time stock market updates tailored to highlight the key catalysts driving short-term price movements. Our coverage is designed for active traders and investors who thrive in fast-moving markets, with a focus on volatile sectors like penny stocks, AI stocks, Robinhood stocks and other momentum plays. From earnings reports and FDA approvals to mergers, new contracts, and unusual trading volume, we break down the events that can spark significant price action.
Looking to level up your trading game? Explore StocksToTrade, the ultimate platform for traders. With powerful tools designed for swing and day trading, integrated news scanning, and even social media monitoring, StocksToTrade keeps you one step ahead.
Check out our quick startup guide for new traders!
- How to Read Stock Charts: A Guide for Beginners
- Trading Plan: 6 Steps to Create One
- How To Create a Stock Watchlist
Ready to build your watchlists? Check out these curated lists:
Once your watchlist is set, take the next step and trade with confidence using StocksToTrade’s robust platform. Don’t miss out — grab your 14-day trial for just $7 and experience the edge you need to thrive in today’s fast-paced markets.