
Leverage Shares 2X Long CBRS Daily ETF faces intensified selling pressure as regulatory and growth concerns dominate sentiment; stocks have been trading down by -16.01 percent.
Click Here for a Millionaire's POV on Trading CBRG
SUBSCRIBE FOR ALERTSJOIN 50,000+ ACTIVE TRADERS
Key Takeaways
- Leverage Shares 2X Long CBRS Daily ETF (CBRG) has dropped more than 60% from late-September highs, signaling a sharp momentum unwind.
- Recent daily candles show heavy selling followed by a tight range, suggesting short-term consolidation after the flush.
- Intraday CBRG trading has cooled, with price pinned around $1.39–$1.40 and lower volatility than earlier in the month.
- Lack of earnings or ratio data leaves chart action as the primary guide for short-term CBRG traders.
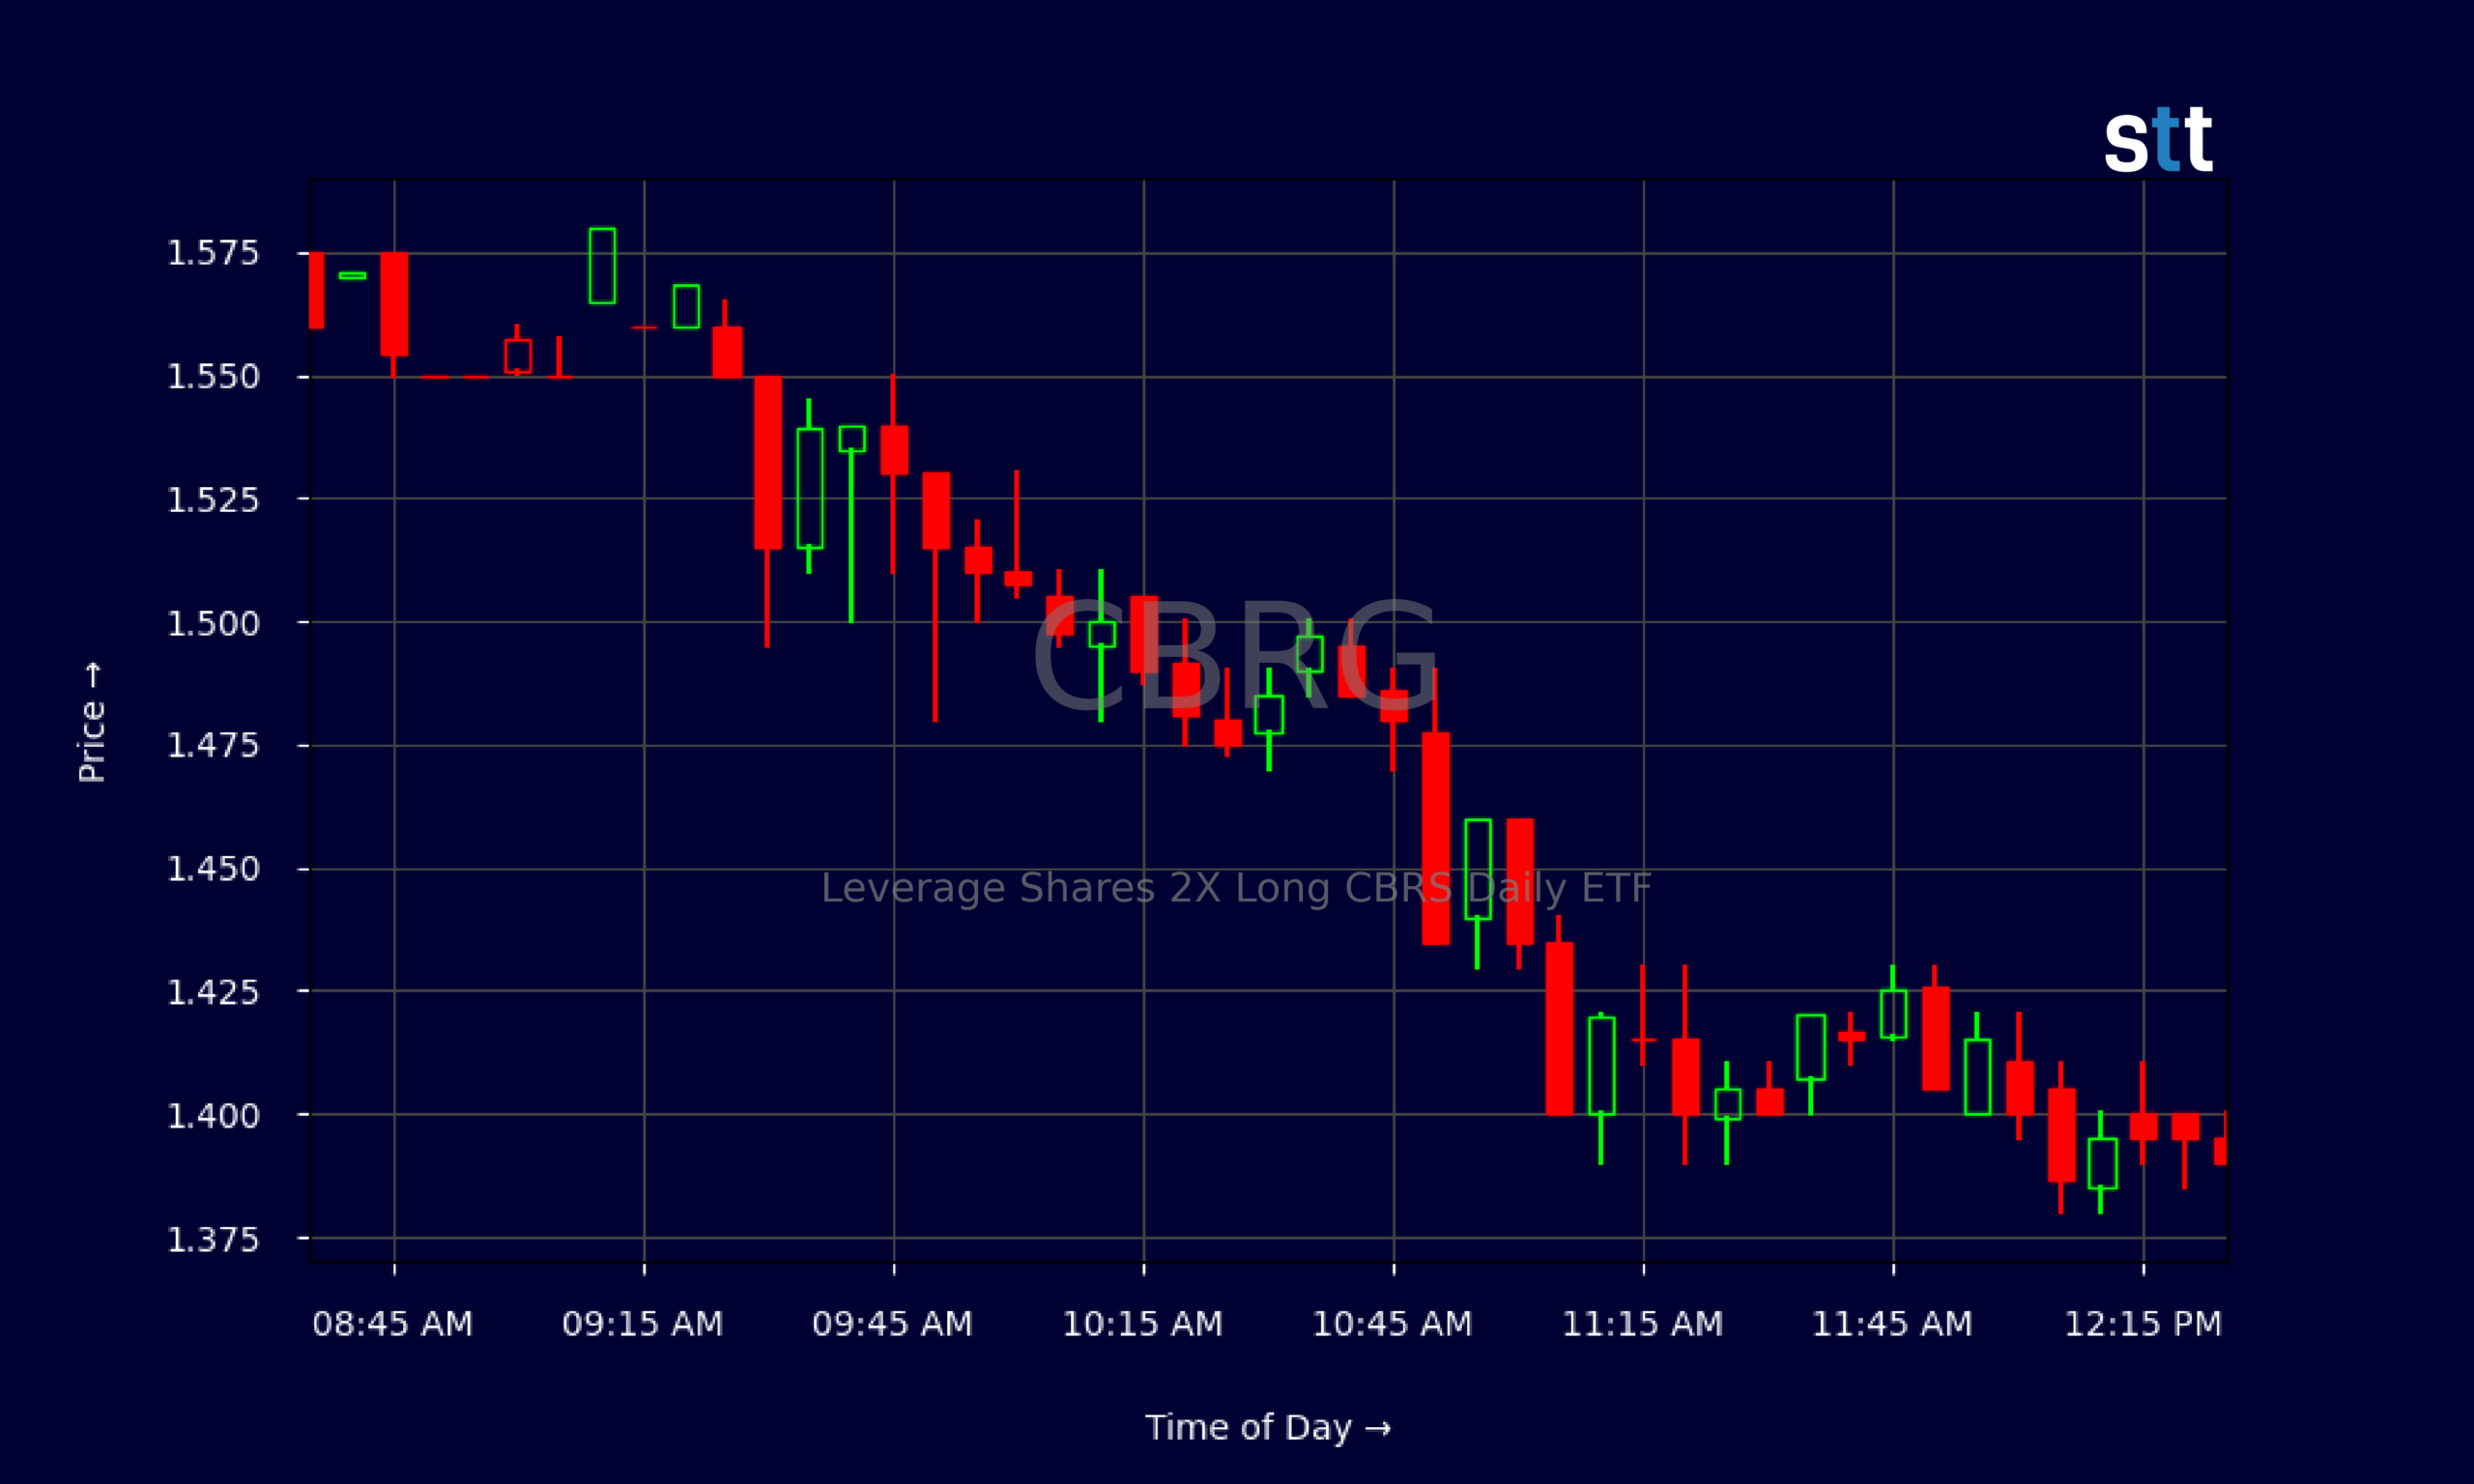
Live Update At 12:35:33 EDT: On Friday, October 16, 2026 Leverage Shares 2X Long CBRS Daily ETF stock [BATS Global Markets: CBRG] is trending down by -16.01%! Discover the key drivers behind this movement as well as our expert analysis in the detailed breakdown below.
Quick Financial Overview
CBRG, the Leverage Shares 2X Long CBRS Daily ETF, is a leveraged product designed to amplify the daily moves of its underlying exposure. That alone tells traders one thing: volatility is the norm, not the exception. With CBRG, a “normal” swing is often 2–3 times what you’d see in a standard ETF tracking the same benchmark.
Looking at CBRG’s recent performance, the story is almost entirely technical. There are no usable revenue, earnings, or margin figures in the latest financial ratio feed. For traders, that shifts the focus from fundamentals to pure price action, liquidity, and risk management.
More Breaking News
- BMNR Stock Tracks Ethereum As Massive Treasury Bet Scales Up
- CRCL Stock Climbs As CFTC Pushes New Crypto Rules
- CBRG ETF Slides As Momentum Traders Watch Key Support
- APLD Stock Slides As Wall Street Turns Cautious On AI Buildout
Over the last few weeks, CBRG has transitioned from a relatively stable $3–$4 range down toward the low $1s. That collapse in price reflects how unforgiving leveraged ETFs can be when the underlying theme falls out of favor. Because CBRG is built for daily compounding, longer holding periods add another layer of decay when volatility runs against the trend. Active traders in CBRG need to think in days and hours, not months, and treat each move as a tactical trade, not a long-term position.
Why Traders Are Watching CBRG’s Technical Levels
The daily chart for CBRG lays out a clean cautionary tale. On 2026/09/21, CBRG closed near $3.77, then pushed as high as the $3.90 area on 2026/09/22. From there, the support kept slipping. By 2026/09/29, CBRG had already faded to a $3.28 close, then $2.70 on 2026/09/30. That steady stair-step lower shows supply overwhelming demand almost every session.
The real breakdown accelerated in early October. CBRG went from a $2.76 close on 2026/10/05 to $2.64 on 2026/10/06, then $2.57 on 2026/10/07, and finally to $2.25–$2.36 on 2026/10/08–2026/10/09. Each bounce was weaker than the last. Buyers tried to defend the $2.40–$2.60 zone, but CBRG kept closing near the lows. That is textbook distribution.
Then came the cliff. On 2026/10/12, CBRG opened above $2.16 but finished at $1.78. The next days continued the pressure, with closes at $1.82, $1.64, $1.66, and finally $1.39 on 2026/10/16. That’s a relentless series of lower highs and lower lows. For momentum traders, CBRG has shifted from breakout candidate to broken chart until it proves otherwise.
Intraday, the 5‑minute tape shows a slow bleed rather than a panic. CBRG started the regular session around $1.55, made a modest push toward $1.53–$1.55 early, then faded steadily into the $1.40 area and held there most of the day. Volatility compressed later in the session, with many candles stuck inside a tight $0.01–$0.02 range. That kind of grind often signals either a base forming…or a pause before another leg down. For now, CBRG traders are watching whether $1.35–$1.40 hardens as support or gives way on the next wave of selling.
Conclusion
For active traders, CBRG is a live example of why leveraged ETFs demand strict discipline. Leverage Shares 2X Long CBRS Daily ETF delivered strong moves when it traded near $3.80 in late September, but the trend turned, and the product did exactly what it was designed to do: magnify the downside. From the $3.90 peak on 2026/09/22 to the $1.39 close on 2026/10/16, CBRG lost more than 60%, and that is before considering intraday swings.
Right now, the key questions are simple. Does CBRG hold the $1.35–$1.40 area and start building a base, or does the selling pressure drive it toward fresh lows? Without clear fundamental data, price is the primary signal. Short-term CBRG traders will focus on prior support zones around $1.60 and $1.80 as potential resistance if any bounce develops.
This is where process matters more than predictions. Tight risk, clear levels, and fast decision-making are essential in a name like CBRG. As Tim Bohen, lead trainer with StocksToTrade says, “Preparation is half the trade. By the time the bell rings, my decisions are nearly made.” As Tim Sykes likes to say, “Cut losses quickly, because small mistakes become big problems when you hesitate.” For those tracking CBRG, the chart is the teacher. The lesson is leverage, and the homework is risk management. This analysis is for educational and research purposes only and is not advice for trading or any other financial decision.
This is stock news, not investment advice. StocksToTrade News delivers real-time stock market updates tailored to highlight the key catalysts driving short-term price movements. Our coverage is designed for active traders and investors who thrive in fast-moving markets, with a focus on volatile sectors like penny stocks, AI stocks, Robinhood stocks and other momentum plays. From earnings reports and FDA approvals to mergers, new contracts, and unusual trading volume, we break down the events that can spark significant price action.
Looking to level up your trading game? Explore StocksToTrade, the ultimate platform for traders. With powerful tools designed for swing and day trading, integrated news scanning, and even social media monitoring, StocksToTrade keeps you one step ahead.
Check out our quick startup guide for new traders!
- How to Read Stock Charts: A Guide for Beginners
- Trading Plan: 6 Steps to Create One
- How To Create a Stock Watchlist
Ready to build your watchlists? Check out these curated lists:
Once your watchlist is set, take the next step and trade with confidence using StocksToTrade’s robust platform. Don’t miss out — grab your 14-day trial for just $7 and experience the edge you need to thrive in today’s fast-paced markets.