

Transocean Ltd (Switzerland) stocks have been trading down by -7.71 percent amid bearish sentiment over weakening offshore drilling demand.
Key Takeaways
- RIG has pushed from roughly $5.50 to above $6.40 over recent weeks, showing steady accumulation on the daily chart.
- Intraday trading in Transocean Ltd (Switzerland) shows tight consolidation around $6.40–$6.45 after an early push toward $6.90.
- RIG’s latest quarter shows about $966M in revenue and positive net income of $170M, signaling improving fundamentals.
- Balance sheet data for Transocean Ltd (Switzerland) shows $795M in cash and manageable long‑term debt near $4.7B.
- Traders are tracking RIG near recent highs as offshore drilling demand and rising revenue trends support the current uptrend.
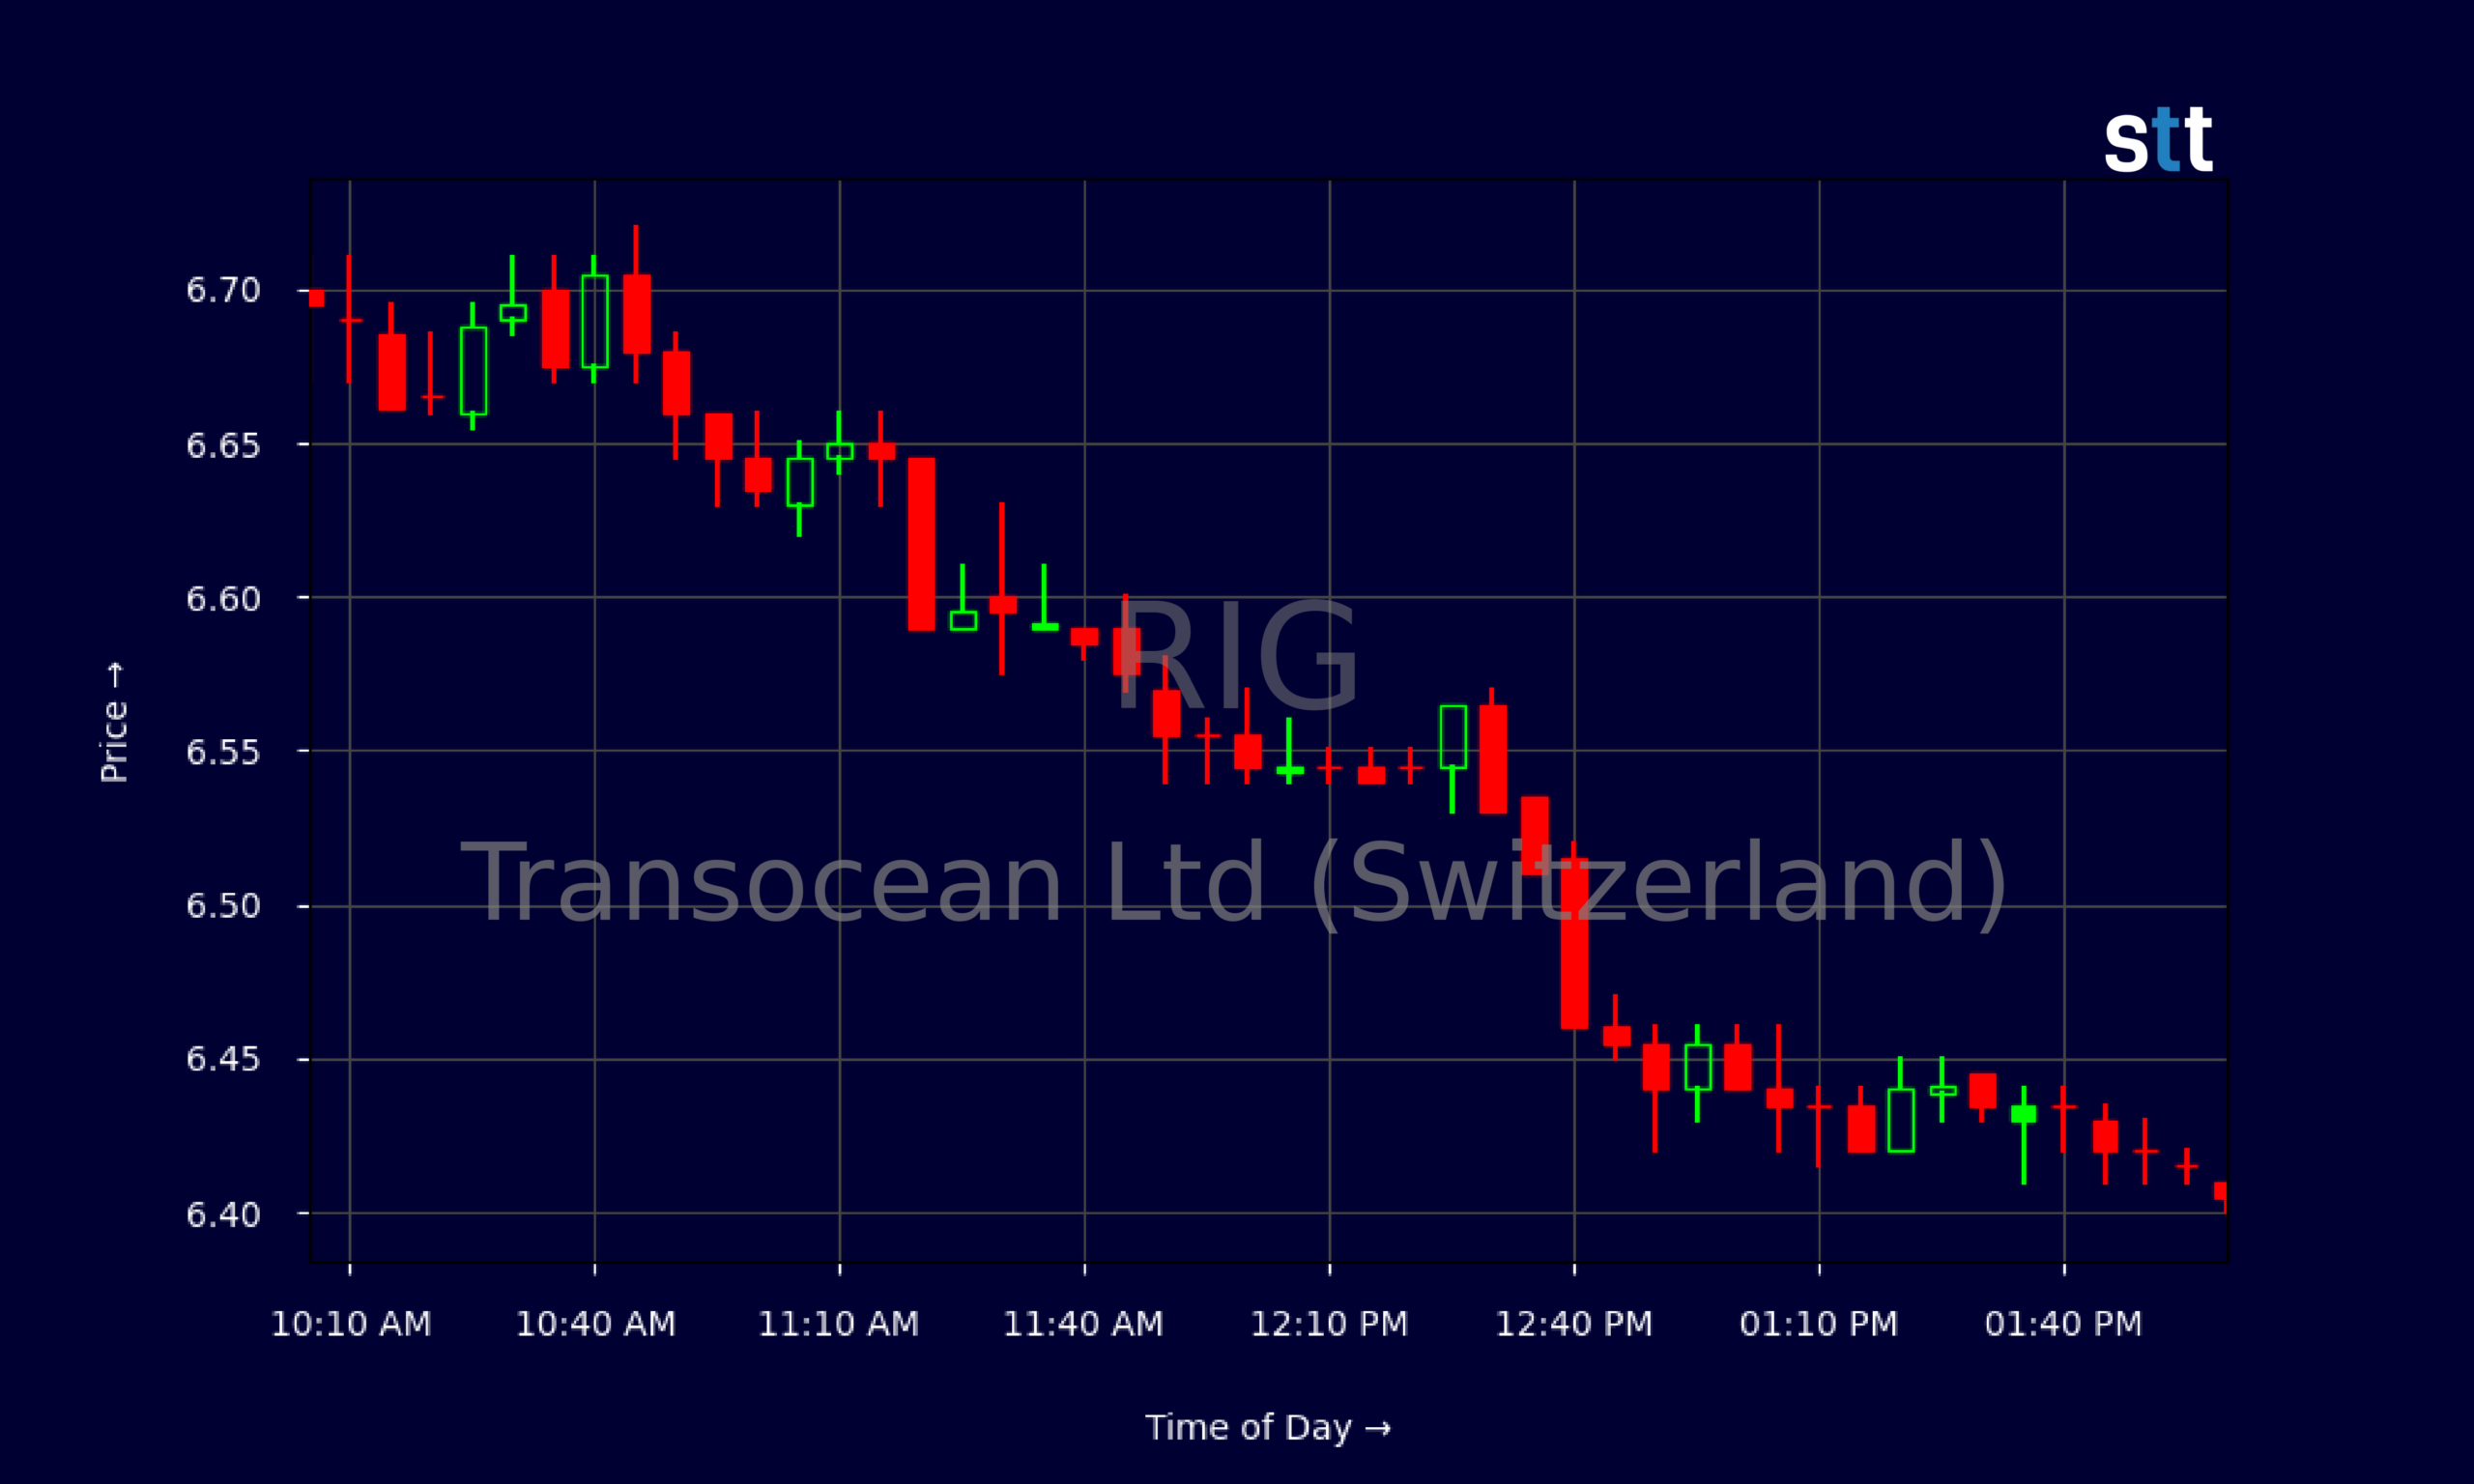
Live Update At 14:03:10 EST: On Monday, November 02, 2026 Transocean Ltd (Switzerland) stock [NYSE: RIG] is trending down by -7.71%! Discover the key drivers behind this movement as well as our expert analysis in the detailed breakdown below.
Quick Financial Overview
RIG is finally looking like a real turnaround story on paper. Transocean Ltd (Switzerland) posted about $966M in quarterly revenue, with net income of $170M. That’s a big shift for a name that has spent years bleeding red ink. EBITDA of $312M and operating income of $154M back up the idea that rigs are busier and dayrates are firming.
For traders, cash flow matters. RIG generated roughly $236M in operating cash flow and $212M in free cash flow in the latest quarter. That gives Transocean Ltd (Switzerland) room to service its roughly $4.7B in long‑term debt without constant refinancing drama. A current ratio of 1.6 shows it can cover near‑term bills, even with a quick ratio of 0.4 reminding everyone this is still a capital‑intensive, cyclical business.
More Breaking News
- Global Payments Stock Jumps As Analysts Hike Targets
- BMNR Stock Pulls Back As Traders Gauge Risk
- FDXF Stock Climbs As Price Action Attracts Momentum Traders
- NCPL Plunges As SEC Fraud Charges Ignite Class Actions
On valuation, RIG trades at about 1.5 times sales and roughly 0.7 times book value. For a company with around $3.97B in annual revenue and improving margins, that’s still a “recovery discount.” Traders watching RIG can treat this as a classic restructuring and cycle‑up play: cleaned‑up cash flows, heavy leverage, and big upside or downside depending on execution and oil prices.
Why Traders Are Watching RIG Price Action
The chart is starting to confirm what the fundamentals are whispering. Over the past few weeks, RIG has climbed from the mid‑$5s to the low‑$6s, with a recent close around $6.41 after a session high near $6.77. That’s a clear short‑term uptrend. Higher lows are stacking: $5.51, $5.62, $5.89, $6.04, then $6.41 and $6.94. This is exactly the type of staircase action trend‑traders like to stalk.
Zoom in to the intraday tape and you see RIG behaving like a stock under accumulation. Pre‑market trade pushed Transocean Ltd (Switzerland) near $6.90–$6.97, then regular hours brought a controlled fade, with tight 5‑minute candles coiling between $6.40 and $6.46 for much of the afternoon. That kind of narrow range after a morning push often signals that strong hands are holding, not bailing.
At the same time, RIG is not a clean growth story. Margins on a trailing basis are still negative at the net level, and returns on equity remain deeply in the red. But the most recent quarter from Transocean Ltd (Switzerland) shows gross margins at 21.5% and a solid operating profit. Traders see that inflection as the fuel behind this latest move.
The setup is simple: RIG riding an improving offshore cycle, fundamentals turning, price grinding higher. Breaks above the recent $6.90–$7.00 zone open the door to a bigger trend. Failure there and a crack back below $6.00 would tell traders the breakout thesis is early or wrong.
Conclusion
For active traders, RIG sits at the crossroads of story and price. The story is a leveraged offshore driller, Transocean Ltd (Switzerland), clawing back to profitability as rigs get busier and dayrates improve. The price is a stock pushing off multi‑month lows, trading at a discount to book value, and respecting higher lows on the daily chart.
The key is not to fall in love with RIG. The company still carries heavy debt, negative long‑term return metrics, and exposure to energy cycles that can turn fast. But free cash flow is positive, quarterly revenue is growing, and the latest numbers show Transocean Ltd (Switzerland) can survive and potentially thrive if the offshore uptrend holds.
Traders in the Tim Sykes world focus on that mix: a clear chart, a logical catalyst, and strict risk control. As Tim Sykes loves to say, “I’m not here to be right, I’m here to trade what’s in front of me and cut losses quickly when I’m wrong.” That mentality aligns closely with the broader trading education space, where risk management is always front and center. As Tim Bohen, lead trainer with StocksToTrade says, “Success in trading is more about cutting losses quickly than finding winners.”. Applied to RIG, that means using the $6.00–$6.10 area as a key line in the sand for many short‑term plans, watching $6.90–$7.00 as the breakout zone, and letting the tape confirm whether Transocean Ltd (Switzerland) is ready for its next leg higher or just pausing before another round of volatility.
This is stock news, not investment advice. StocksToTrade News delivers real-time stock market updates tailored to highlight the key catalysts driving short-term price movements. Our coverage is designed for active traders and investors who thrive in fast-moving markets, with a focus on volatile sectors like penny stocks, AI stocks, Robinhood stocks and other momentum plays. From earnings reports and FDA approvals to mergers, new contracts, and unusual trading volume, we break down the events that can spark significant price action.
Looking to level up your trading game? Explore StocksToTrade, the ultimate platform for traders. With powerful tools designed for swing and day trading, integrated news scanning, and even social media monitoring, StocksToTrade keeps you one step ahead.
Check out our quick startup guide for new traders!
- How to Read Stock Charts: A Guide for Beginners
- Trading Plan: 6 Steps to Create One
- How To Create a Stock Watchlist
Ready to build your watchlists? Check out these curated lists:
Once your watchlist is set, take the next step and trade with confidence using StocksToTrade’s robust platform. Don’t miss out — grab your 14-day trial for just $7 and experience the edge you need to thrive in today’s fast-paced markets.