

LEIFRAS Co. Ltd. shares rally as the most impactful regulatory approval news fuels optimism; stocks have been trading up by 56.27 percent
Market Insights For Active LFS Traders
- Weekly chart for LFS shows a sharp surge from the low $1s into the $3 area, signaling expanding volatility and growing trader interest.
- Intraday action around $3.55 printed a wide range from $3.15 to $4.58, highlighting aggressive two-way tape and fast momentum rotations.
- Balance sheet for LEIFRAS Co. Ltd. carries over $2.5B in cash, giving the company meaningful flexibility despite its small equity valuation.
- Valuation for LFS screens low on sales but rich on book value, pointing to a market willing to pay for return on capital rather than asset backing.
- Traders in LFS are watching whether recent spikes resolve into a sustained trend or fade back toward prior consolidation near the mid-$1 range.
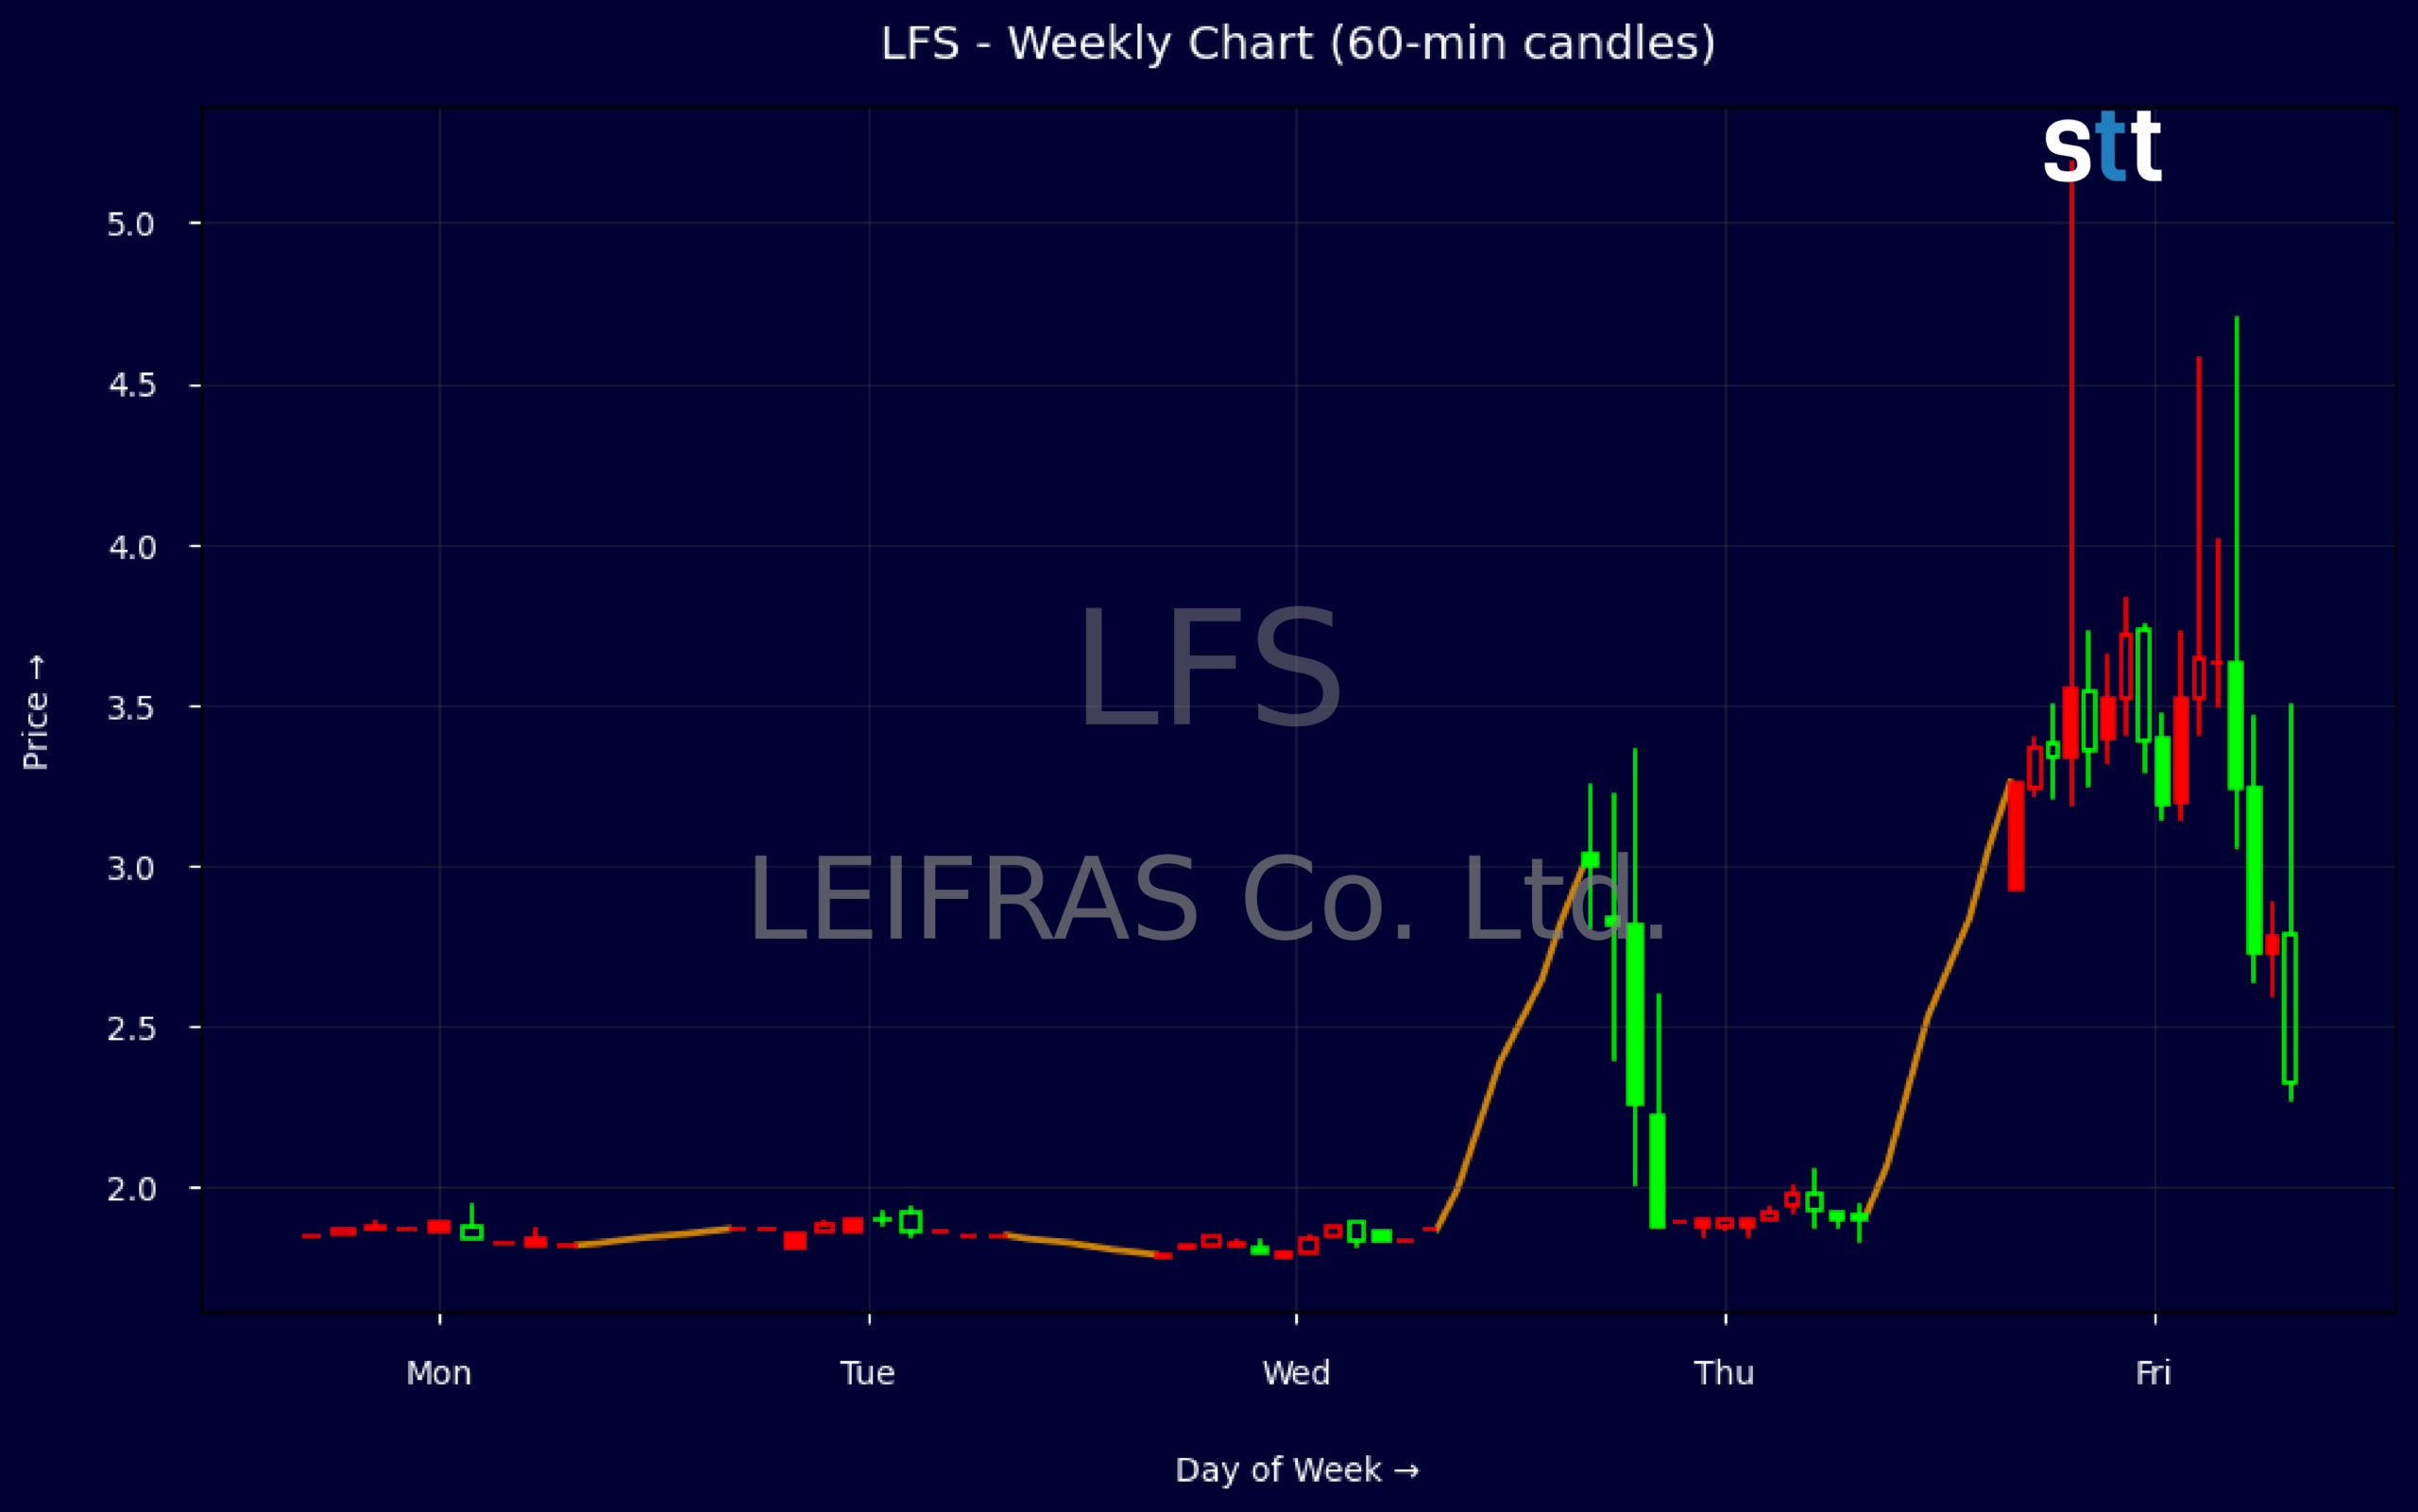
Weekly Update May 18 – May 22, 2026: On Saturday, May 23, 2026 LEIFRAS Co. Ltd. stock [NASDAQ: LFS] is trending up by 56.27%! Discover the key drivers behind this movement as well as our expert analysis in the detailed breakdown below.
Consumer Staples industry expert:
Analyst sentiment – positive
LFS operates a niche education-focused staples platform with a small-cap enterprise value of ~$83M and modest 0.65x price-to-sales, suggesting the market discounts its revenue quality despite strong economics. ROIC at 17.4% is firmly value-creating, supported by a clean balance sheet with long-term debt-to-capital of only 0.16 and leverage of 2.5x. Cash of ~$2.5B against total assets of ~$4.7B and working capital of ~\$1.2B underscore very high liquidity and ample strategic flexibility.
Technically, LFS has transitioned from a low-volatility base (1.81–1.87) into a high-momentum breakout, spiking to 5.19 before closing back at 2.93, signaling aggressive speculative flow and profit-taking. The dominant trend on the weekly timeframe is up, but short-term overextended. For trading, 2.80–3.00 is the key pivot zone: above 3.00 on strong volume favors a momentum long, while a sustained break below 2.80 would confirm a failed breakout and favor short/underweight positioning.
More Breaking News
- CDE Stock Pullback Has Active Metals Traders On Watch
- SNDG ETF Slides As Volatility Pressures Bullish Traders
- MSTR Stock Holds Key Range As Volatility Tightens
- SNDG ETF Slides As Volatility Grips Short-Term Traders
With no material recent news, the move looks primarily technical rather than fundamental. Versus broader Consumer Staples and Education peers, LFS screens as cheaper on sales but stronger on ROIC and balance sheet quality, warranting a premium to current multiples. Near term, key support sits at 2.50, with resistance at 3.50 and then 5.00. My 6–12 month base-case target is 3.75, assuming stabilization above 3.00 and normalized volatility.
Quick Financial Overview
LEIFRAS Co. Ltd. trades with the profile of a small-cap name sitting on a surprisingly large asset base. Enterprise value is about $82.6M, while cash and cash equivalents sit near $2.52B, giving LFS a deep liquidity cushion versus its market footprint. That mismatch tells traders the equity is pricing in heavy liabilities, execution risk, or both, but it also means downside scenarios may be buffered by available cash.
On the balance sheet, total assets are around $4.68B with total equity near $1.85B, implying material leverage but not an extreme capital structure. A leverageratio of 2.5 and long-term debt and lease obligations under $350M, against over $2.5B in cash, put LEIFRAS Co. Ltd. in a position to handle near-term obligations. Working capital above $1.22B adds another layer of safety, which matters for traders who worry about sudden liquidity events.
From a valuation lens, a price-to-sales ratio of 0.65 looks cheap versus typical growth names, but a price-to-book of 4.12 and price-to-tangible-book of 4.25 say the market is paying up for earnings power. Return on assets is currently recorded at 0, yet a 17.4% one-year return on capital hints at improving efficiency in how LFS deploys its base. For short-term traders, that blend of low sales multiple and strong capital returns can support breakout moves when volume surges.
Conclusion
The recent tape in LFS shows why traders gravitate to this kind of setup. Weekly candles jumped from a tight band around $1.81–$1.87 into a spike toward $3.34, then extended with a high near $5.19 before closing the latest week around $2.93. That move, followed by intraday swings between $3.15 and $4.58, marks LEIFRAS Co. Ltd. as a name where liquidity meets emotion, and where risk management matters more than prediction.
Financially, the story underneath that volatility is unusual. LEIFRAS Co. Ltd. sits on billions in assets and more than $2.5B in cash, while the equity value and enterprise value remain modest. Solid working capital and a respectable 17.4% return on capital suggest the business is not distressed, even if the equity price behaves like a speculative trading vehicle. That gap between balance-sheet strength and price instability is exactly what draws day traders and swing traders.
For traders, the key questions now are simple: does LFS build a base above the $2.50–$3.00 zone, or does price drift back toward the old $1 handle as the surge cools? Intraday levels around $3.50 and the recent high near $4.50–$5.00 form obvious reference points for risk and reward planning. As Tim Bohen, lead trainer with StocksToTrade says, “I focus on momentum that’s visible right now. Speculation on future moves is outside my playbook.” That philosophy lines up with how I approach this chart. As I tell my students, “You do not get paid for calling the future in names like LFS — you get paid for defining your levels, sizing your risk, and executing when the chart finally tips its hand.”
This is stock news, not investment advice. StocksToTrade News delivers real-time stock market updates tailored to highlight the key catalysts driving short-term price movements. Our coverage is designed for active traders and investors who thrive in fast-moving markets, with a focus on volatile sectors like penny stocks, AI stocks, Robinhood stocks and other momentum plays. From earnings reports and FDA approvals to mergers, new contracts, and unusual trading volume, we break down the events that can spark significant price action.
Looking to level up your trading game? Explore StocksToTrade, the ultimate platform for traders. With powerful tools designed for swing and day trading, integrated news scanning, and even social media monitoring, StocksToTrade keeps you one step ahead.
Check out our quick startup guide for new traders!
- How to Read Stock Charts: A Guide for Beginners
- Trading Plan: 6 Steps to Create One
- How To Create a Stock Watchlist
Ready to build your watchlists? Check out these curated lists:
Once your watchlist is set, take the next step and trade with confidence using StocksToTrade’s robust platform. Don’t miss out — grab your 14-day trial for just $7 and experience the edge you need to thrive in today’s fast-paced markets.