
Keel Infrastructure Corp. stocks have been trading down by -7.98 percent after reports of financing delays on key infrastructure projects.
Click Here for a Millionaire's POV on Trading KEEL
SUBSCRIBE FOR ALERTSJOIN 50,000+ ACTIVE TRADERS
Key Takeaways
- Shares of Keel Infrastructure Corp. have dropped from above $4.00 to the mid‑$2.00s, breaking recent support and signaling fading momentum.
- KEEL’s latest quarter shows revenue of about $30.4M but a steep net loss near $65M, highlighting serious profitability challenges.
- The company carries over $1.0B in long‑term debt but also holds more than $700M in cash, giving KEEL room to operate despite heavy losses.
- Intraday trading in KEEL now shows tight consolidation near $2.35–$2.40, suggesting traders are waiting for the next clear move.
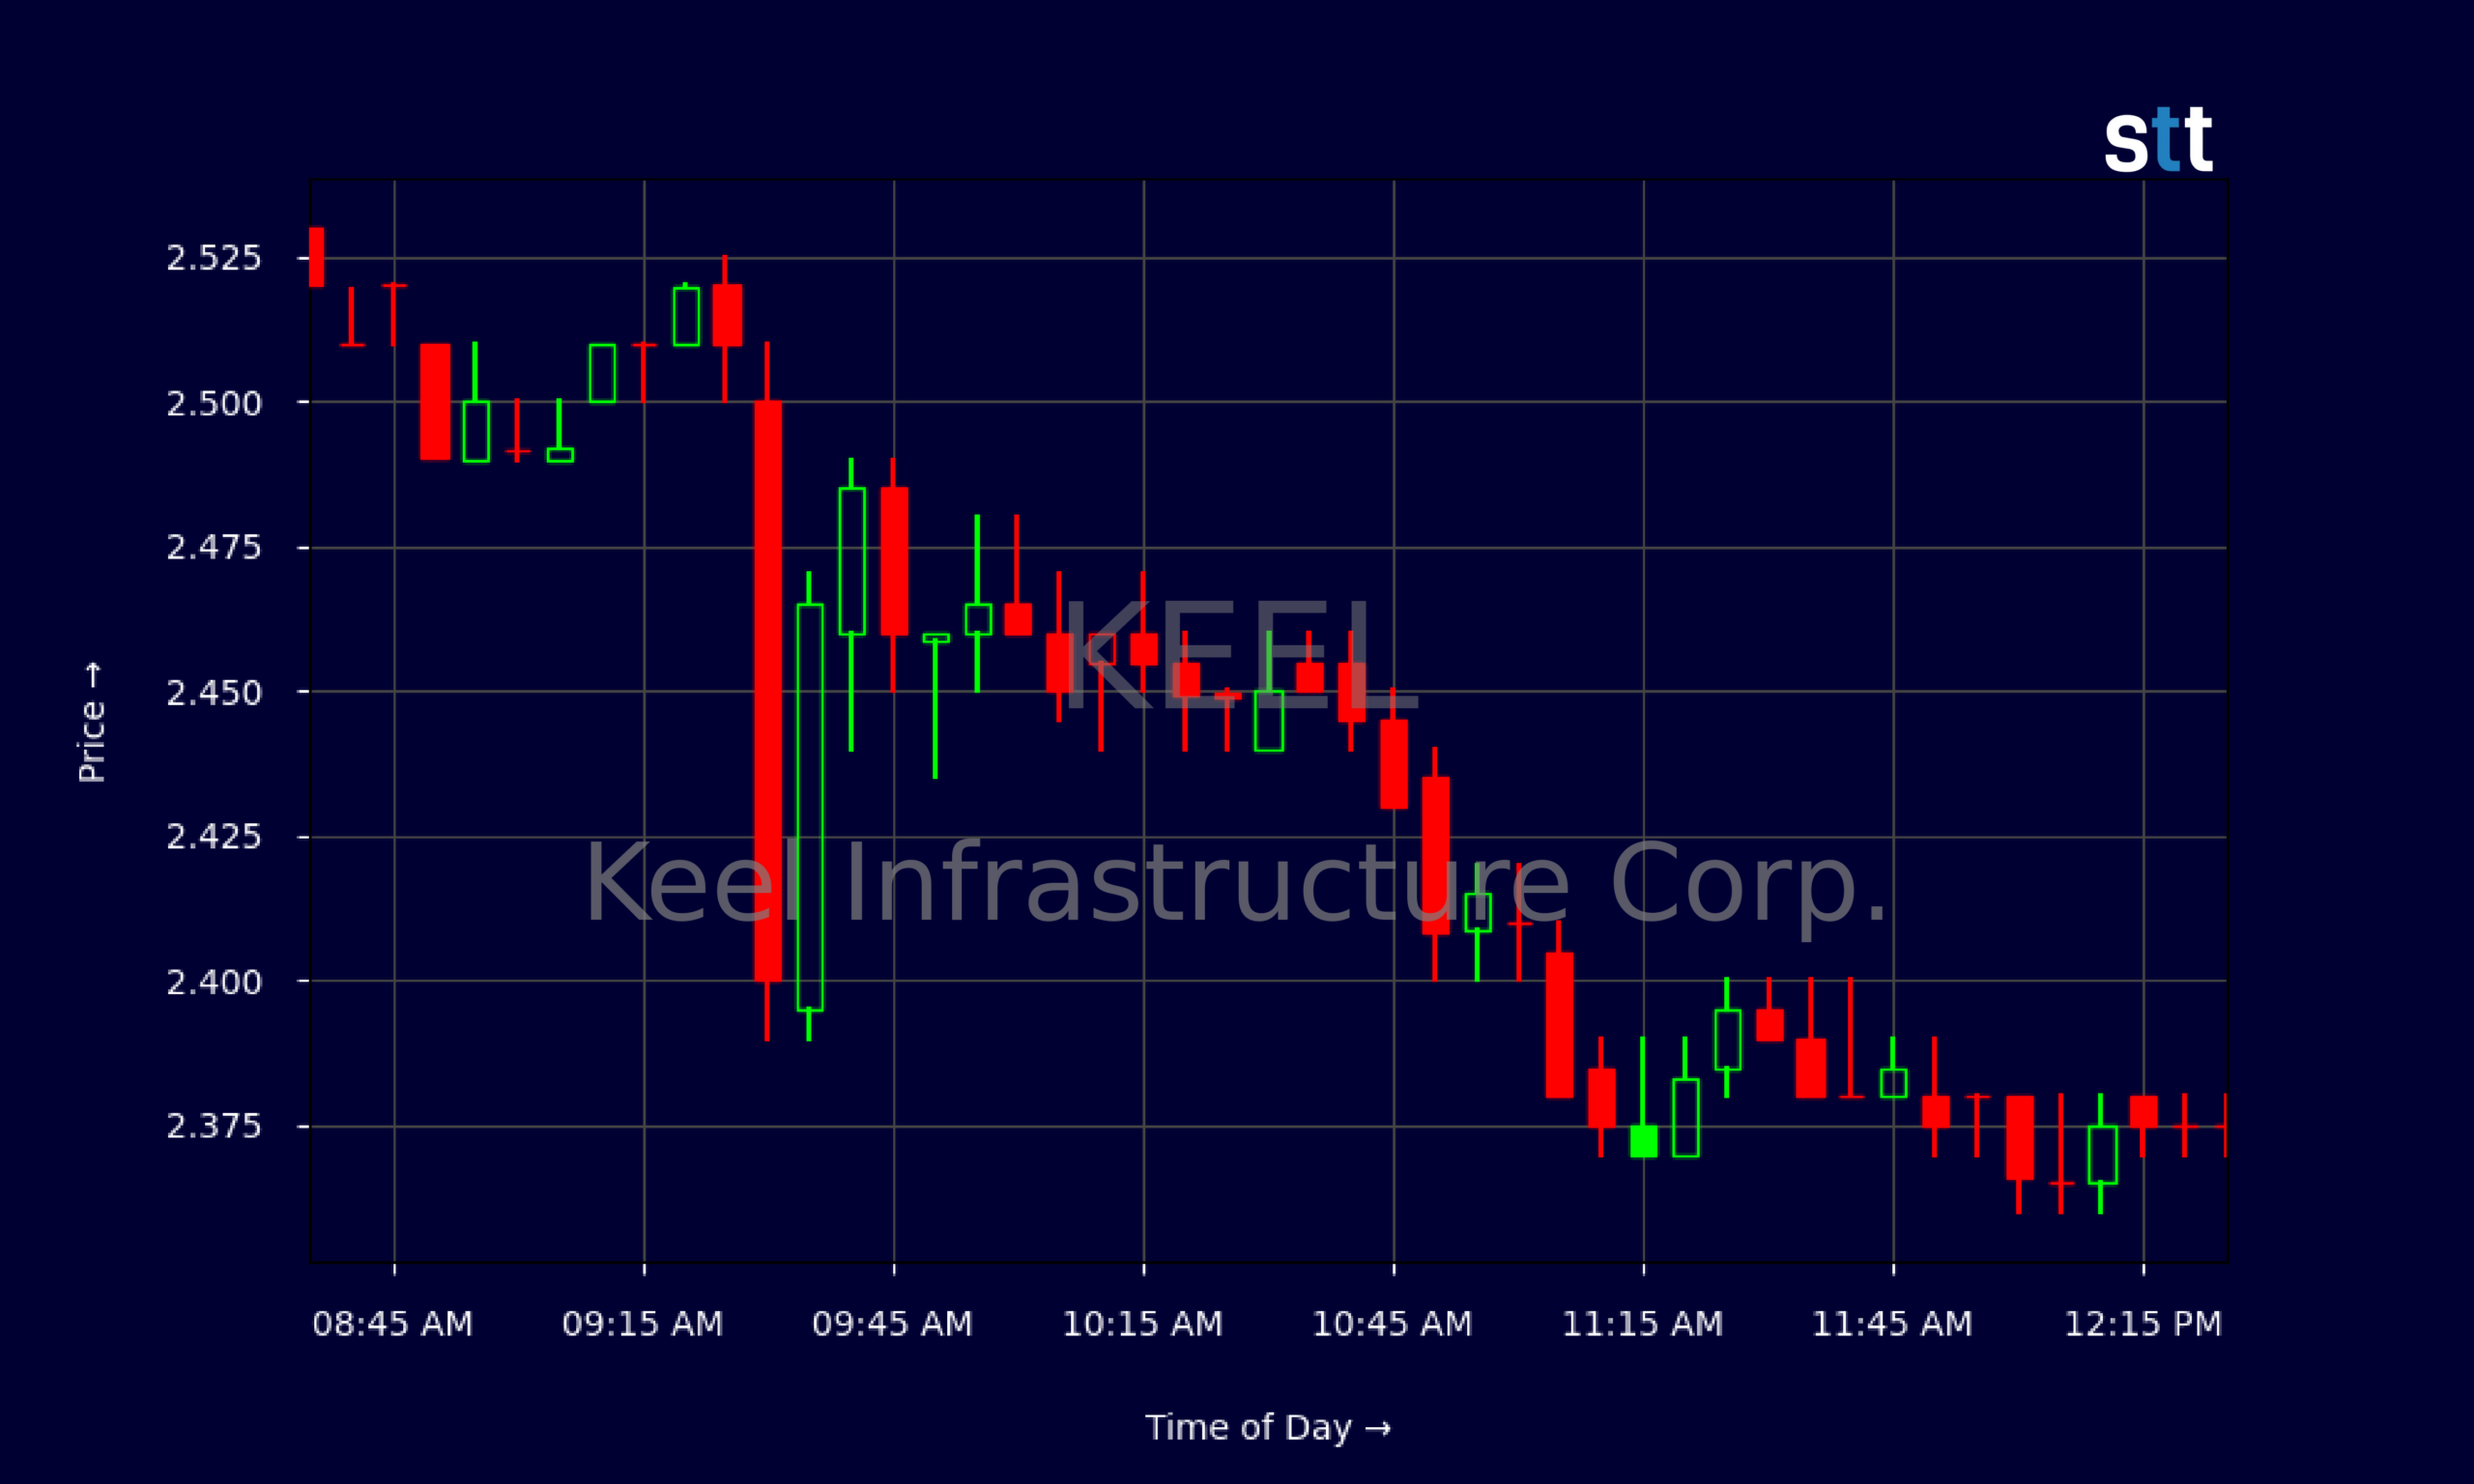
Live Update At 12:32:07 EDT: On Friday, October 16, 2026 Keel Infrastructure Corp. stock [NASDAQ: KEEL] is trending down by -7.98%! Discover the key drivers behind this movement as well as our expert analysis in the detailed breakdown below.
Quick Financial Overview
Keel Infrastructure Corp., trading under ticker KEEL, is posting growth on the top line but bleeding on the bottom line. For the latest reported quarter, KEEL generated about $30.4M in total revenue. That sounds decent for a smaller infrastructure name, but the problem is the cost structure. Total expenses came in near $150.4M, leaving operating income around negative $118.1M and net income at roughly negative $65.0M.
That translates to a basic and diluted EPS of about -$0.11, and the margins back it up. KEEL’s profit margin metrics are deeply negative, with gross margin around -70.7% and EBIT margin worse than -190%. For traders, this screams “story stock” rather than a clean fundamental winner.
More Breaking News
- XLAB Stock Whipsaws As Traders Target Volatile Range
- CBRG ETF Slides As Momentum Traders Watch Key Support
- TSLA Rallies As AI Story And Q3 Delivery Beat Ignite Bulls
- OPK Stock Holds Support As Traders Gauge Turnaround Odds
On the balance sheet, KEEL shows total assets of roughly $1.42B and stockholders’ equity around $328.7M. Long‑term debt sits just over $1.0B, but KEEL also holds about $715.5M in cash and equivalents. The current ratio above 16.0 looks strong, yet leverage is high. This mix of big cash, heavy debt, and large losses makes KEEL a classic battleground name for active trading.
Why Traders Are Watching KEEL Price Action
KEEL has been in a clear downtrend on the daily chart. In late September, Keel Infrastructure Corp. was closing around $4.00, with highs near $4.17. Since then, each week has pushed lower highs and lower lows. More recently, KEEL slipped from the $3.60s into the low‑$3.00s, and now it trades in the mid‑$2.00s, with the latest daily close near $2.37. That’s a sharp drawdown for short‑term traders who chased strength up top.
The intraday 5‑minute chart shows a different story: calm, controlled selling followed by tight consolidation. Early in the session, KEEL traded around $2.50–$2.48. From there, the stock drifted lower toward $2.40 and then into the $2.36–$2.38 zone. The range has narrowed, with many candles holding just a few cents wide. That kind of compression often precedes a stronger move — either a bounce or another leg down.
When traders look under the hood, the fundamentals match the chart’s caution. KEEL’s return on equity sits around -42% to -72% depending on the time frame, and return on assets is also firmly negative. The company is still in heavy build‑out mode: big depreciation, big operating losses, and negative free cash flow near -$95.9M despite substantial financing inflows.
Yet KEEL also has a war chest. With more than $715M in cash and a current ratio over 16, Keel Infrastructure Corp. is not on the brink tomorrow. That’s exactly why day traders like this kind of name. KEEL has enough capital to keep the story alive, but the economics are weak enough that every earnings update or rate move can trigger sharp price swings. For momentum and short‑bias traders, KEEL is a chart to keep on screen.
Conclusion
For active traders, KEEL is a lesson in what happens when strong balance sheet liquidity collides with brutal profitability. Keel Infrastructure Corp. shows meaningful revenue growth and a sizeable asset base, but the cost of generating that revenue is sky‑high. Negative gross margins and huge operating losses explain why the stock has sunk from above $4.00 into the $2.00s over the past several weeks.
At the same time, KEEL’s $715M‑plus cash position and high current ratio mean the company still has serious runway. That mix of heavy debt, big cash, and ongoing losses sets up exactly the kind of volatility short‑term traders hunt. On the daily chart, KEEL is trending down. On the intraday chart, it’s coiling in a tight band near recent lows. Those setups can produce clean breakdowns or sharp short squeezes, depending on who blinks first.
Traders following the Tim Sykes and StocksToTrade style will treat KEEL as a pure trading vehicle — not a long‑term safety play. The plan is straightforward: respect the trend, map key support and resistance, and react to price, not hope. As Tim Bohen, lead trainer with StocksToTrade says, “I never chase price. The best opportunities allow me to enter on my terms, not when I’m feeling pressured.” As Tim Sykes likes to remind his community, “Every trade is just a trade — you’re not marrying the stock.” In a name like KEEL, that mindset matters even more. This analysis is for educational and research purposes only, and any trading decisions remain the sole responsibility of each individual trader.
This is stock news, not investment advice. StocksToTrade News delivers real-time stock market updates tailored to highlight the key catalysts driving short-term price movements. Our coverage is designed for active traders and investors who thrive in fast-moving markets, with a focus on volatile sectors like penny stocks, AI stocks, Robinhood stocks and other momentum plays. From earnings reports and FDA approvals to mergers, new contracts, and unusual trading volume, we break down the events that can spark significant price action.
Looking to level up your trading game? Explore StocksToTrade, the ultimate platform for traders. With powerful tools designed for swing and day trading, integrated news scanning, and even social media monitoring, StocksToTrade keeps you one step ahead.
Check out our quick startup guide for new traders!
- How to Read Stock Charts: A Guide for Beginners
- Trading Plan: 6 Steps to Create One
- How To Create a Stock Watchlist
Ready to build your watchlists? Check out these curated lists:
Once your watchlist is set, take the next step and trade with confidence using StocksToTrade’s robust platform. Don’t miss out — grab your 14-day trial for just $7 and experience the edge you need to thrive in today’s fast-paced markets.