

Haleon plc faces heightened investor concern over product litigation risks, with stocks having been trading down by -14.55 percent.
Key Takeaways
- Price action in HLN shows a sharp break from the $10 range down toward the mid-$8s, signaling a change in short‑term momentum.
- Intraday HLN trading has shifted into a tight consolidation band around $8.50, suggesting traders are debating the next leg.
- Profit margins at Haleon plc remain strong, but revenue growth is flat to slightly negative over three years.
- HLN carries moderate leverage with a low current ratio, so balance‑sheet strength is solid but not bulletproof.
- Active traders are watching prior support near $8.80–$9.00 on HLN as a key area for potential bounces or further breakdowns.
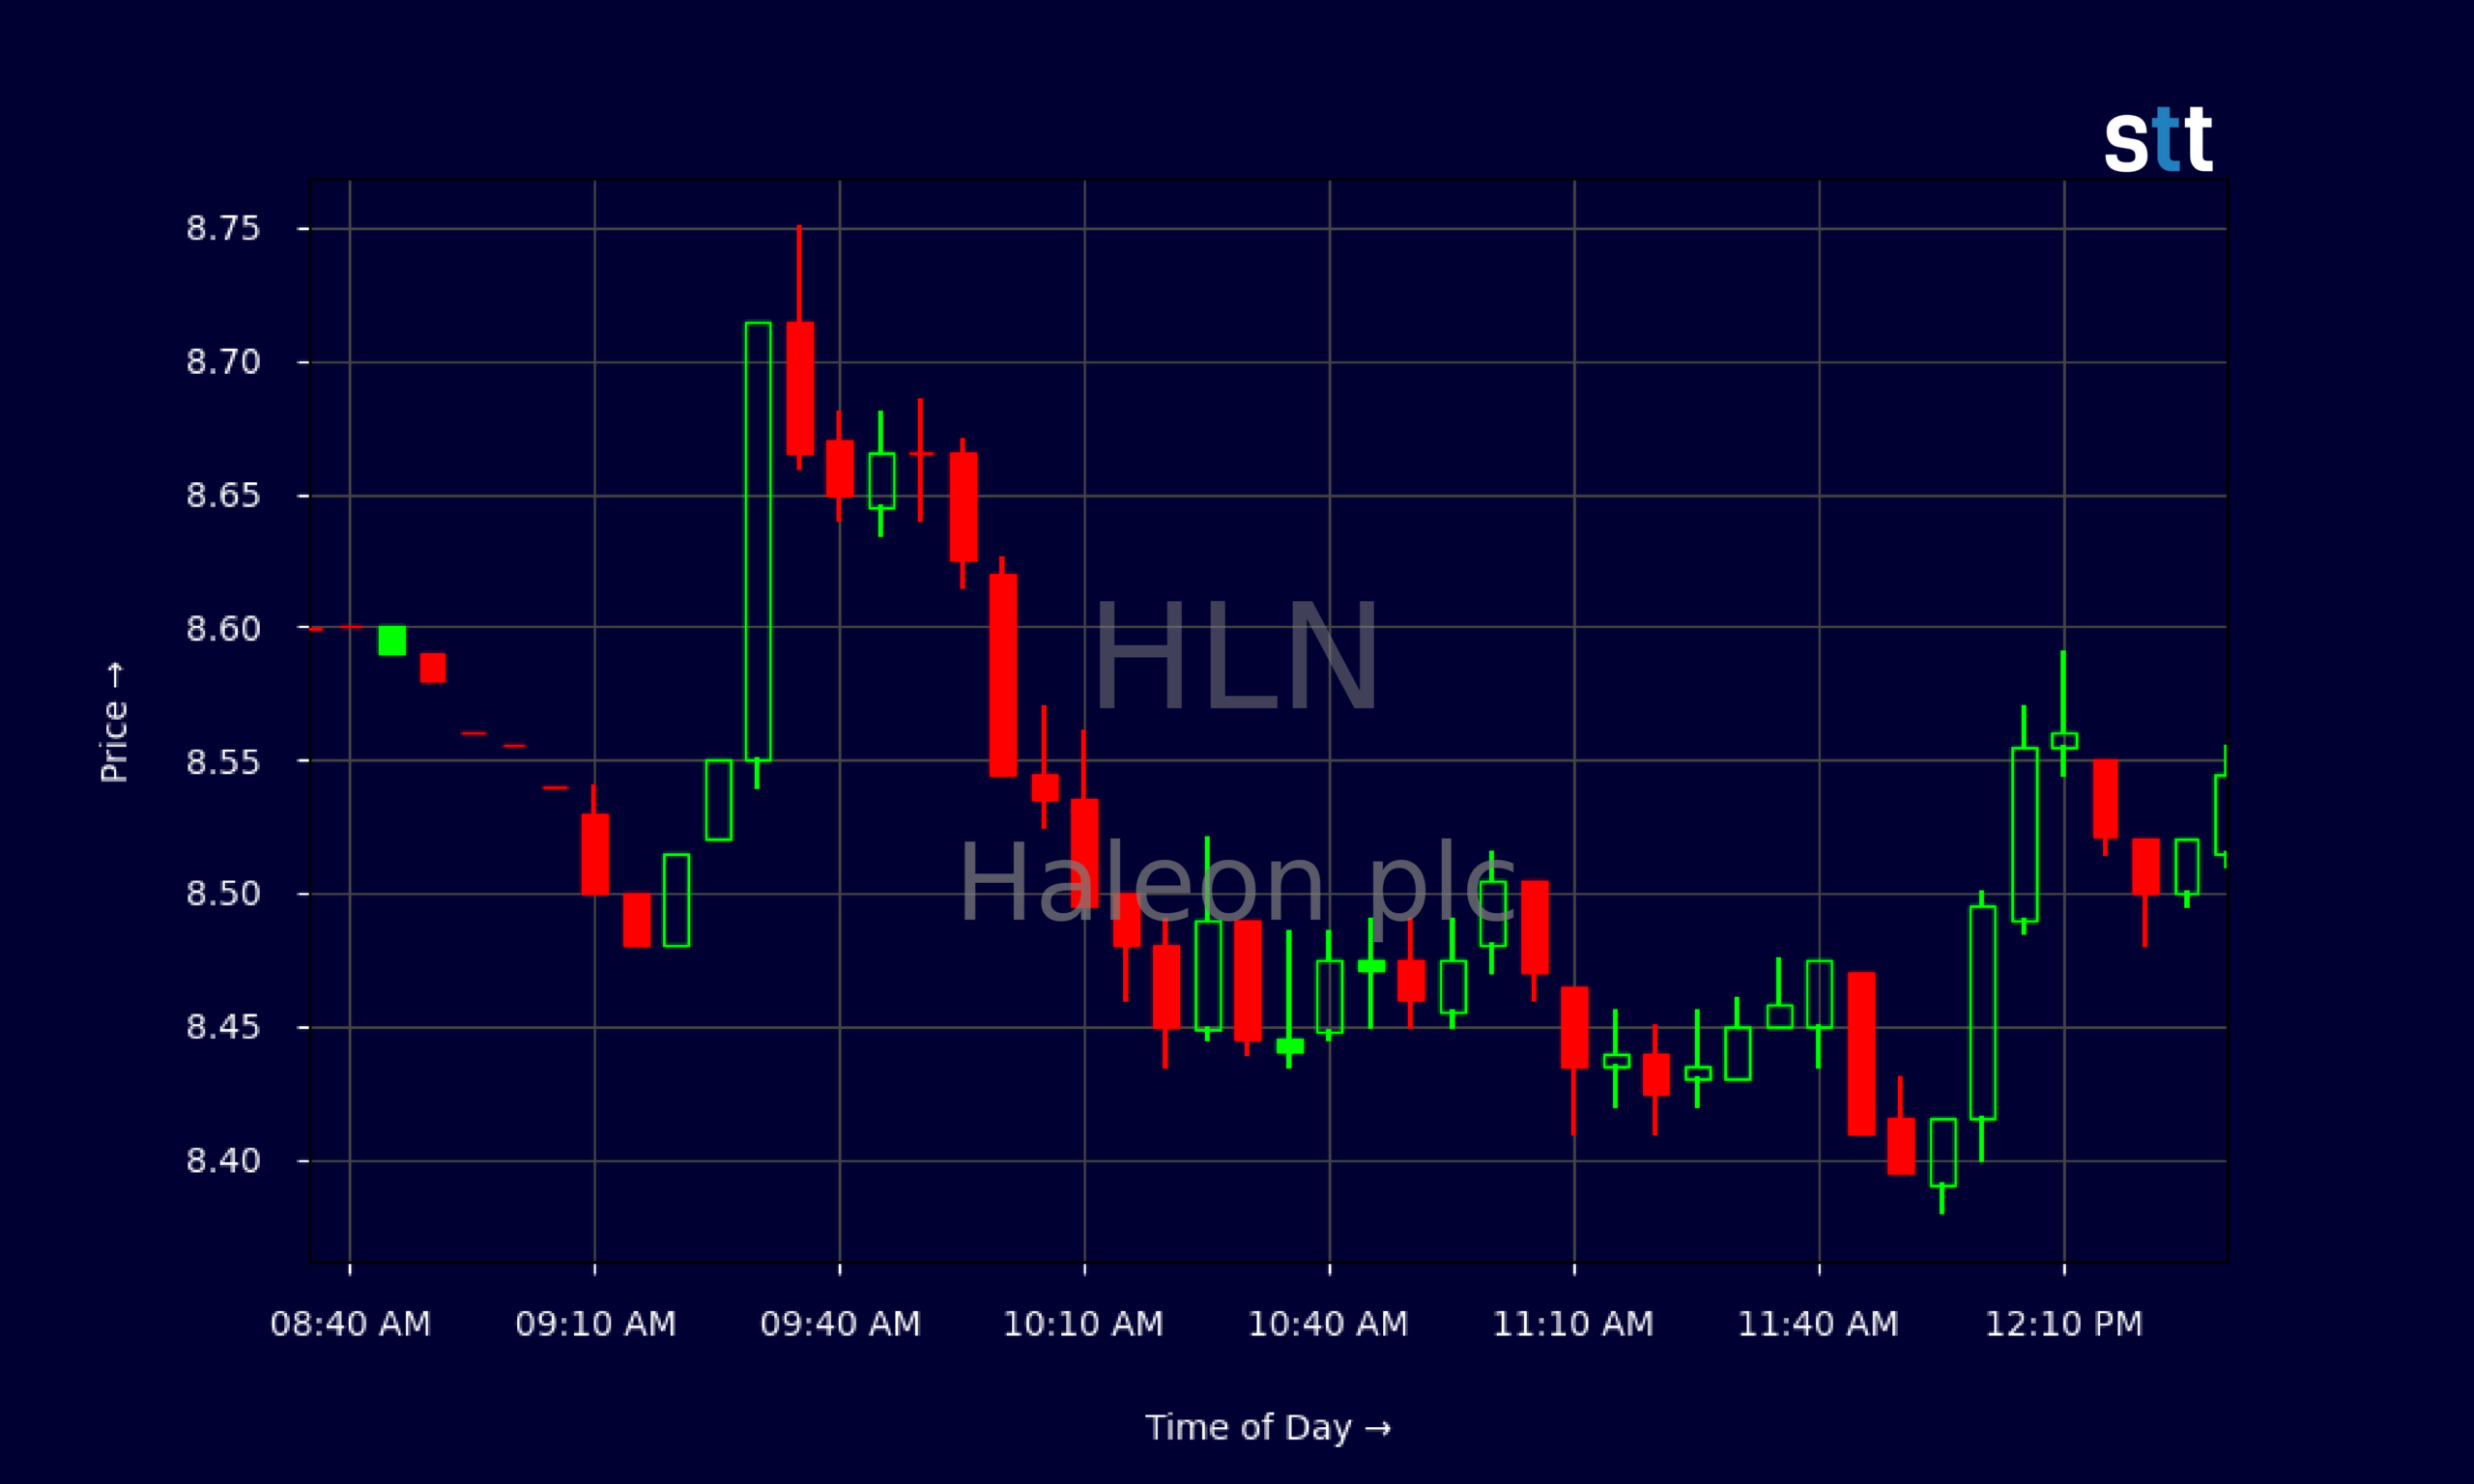
Live Update At 12:33:59 EDT: On Thursday, October 29, 2026 Haleon plc stock [NYSE: HLN] is trending down by -14.55%! Discover the key drivers behind this movement as well as our expert analysis in the detailed breakdown below.
Quick Financial Overview
HLN, the consumer‑health spinout now trading on its own, is a classic “steady business, choppy stock” setup. Haleon plc posts about $11.03B in annual revenue with a healthy gross margin near 65%. That means HLN keeps roughly two‑thirds of every sales dollar after basic product costs, a strong base for a defensive name.
On the bottom line, HLN runs an EBIT margin of 22% and profit margin around 14–15%. Those are solid numbers, not hyper‑growth tech, but the kind of dependable earnings traders often lean on in volatile markets. The trade‑off is growth: revenue over the last three years is slightly negative, so the HLN story is more about efficiency and brand power than rapid expansion.
More Breaking News
- Amrize Ltd Falls 7% After Sales Miss and Weak Outlook
- INSM Stock Jumps As BRINSUPRI Rollout Expands Globally
- NUWE Stock Rockets As Pediatric Strategy Grabs Trader Attention
- SoFi Technologies Stock Rockets After Earnings Beat And Bold 2027 Targets
Valuation is middle of the road. A P/E around 19.4 and price‑to‑sales near 2.75 put HLN in “reasonably priced quality” territory, not a deep value bargain but not a bubble either. Debt metrics matter here. Total debt to equity at 0.5 and interest coverage at 8.8 show Haleon plc can handle its obligations, though a current ratio of 0.7 keeps pressure on cash management. For traders, HLN looks like a stable earnings machine currently dealing with unstable price action.
Why Traders Are Watching HLN Price Support
The real story for active traders is the chart. HLN spent much of the recent daily action grinding higher from the high‑$8s to the low‑$10s. Then the floor gave out. After closing at $10.00, Haleon plc dropped hard into the mid‑$8s, finishing the latest session around $8.545. That’s more than a 14% slide from recent highs near $10.37, a clear signal that momentum bulls lost control.
On the multi‑day chart, HLN had been respecting the $9.50–$10.30 band, with a slow, steady uptrend. When a defensive consumer‑health name like Haleon plc suddenly cracks that range, experienced traders pay attention. That kind of move often means bigger funds rotated out, or that expectations simply got ahead of reality.
Zoom into the intraday 5‑minute data and HLN shows a classic “gap‑down, grind‑sideways” pattern. Pre‑market prints ran near $8.80–$8.90. The regular‑session open around $8.55 saw an early push to $8.75, then a steady bleed down toward the low‑$8.40s before a mild midday bounce to the $8.50s. Range tightened quickly, with HLN oscillating roughly between $8.40 and $8.60 for hours.
That compression tells traders the panic phase passed, at least for now, and Haleon plc has slipped into decision mode. Either HLN holds this $8.40–$8.60 area and builds a base, or it loses that line and heads toward prior support from early in the run.
For short‑term players, the key levels are simple. On the upside, reclaiming $8.90–$9.00 would show HLN regaining lost ground and possibly turning the breakdown into a shakeout. On the downside, a decisive break under $8.40 with volume would likely invite more selling as stops trigger. With HLN’s solid but not blazing fundamentals, this is the kind of tape where chart discipline matters more than storytelling.
Conclusion
HLN sits at an interesting crossroads where strong fundamentals meet weak price action. Haleon plc runs a profitable, wide‑margin consumer‑health operation with a 22% EBIT margin, respectable returns on equity, and a reasonable P/E for the sector. At the same time, revenue growth is soft, leverage is manageable but present, and the current ratio under 1 means Haleon plc cannot relax on liquidity.
Traders in HLN need to respect that contrast. The long‑term story is steady brands and cash flow. The short‑term story is a broken $10 level, heavy selling pressure, and a new battle line around the mid‑$8s. Until HLN either reclaims lost resistance or knifes through support, this is a textbook wait‑for‑the‑chart setup, not a “close your eyes and hope” situation. As Tim Bohen, lead trainer with StocksToTrade says, “A good trade setup checks all the boxes—volume, trend, catalyst. Don’t trade if you’re missing pieces of the puzzle.” In the case of HLN, that means patiently waiting until the chart, liquidity, and catalysts all align instead of forcing trades based only on the fundamental story.
For newer traders tracking HLN, this is where discipline separates pros from gamblers. As Tim Sykes loves to say, “The market doesn’t care about your opinion, it cares about price action—so trade the chart, not the story.” Haleon plc gives you the quality backdrop; HLN’s chart tells you when the timing actually makes sense. This content is for educational and research purposes only and should not be taken as investment advice.
This is stock news, not investment advice. StocksToTrade News delivers real-time stock market updates tailored to highlight the key catalysts driving short-term price movements. Our coverage is designed for active traders and investors who thrive in fast-moving markets, with a focus on volatile sectors like penny stocks, AI stocks, Robinhood stocks and other momentum plays. From earnings reports and FDA approvals to mergers, new contracts, and unusual trading volume, we break down the events that can spark significant price action.
Looking to level up your trading game? Explore StocksToTrade, the ultimate platform for traders. With powerful tools designed for swing and day trading, integrated news scanning, and even social media monitoring, StocksToTrade keeps you one step ahead.
Check out our quick startup guide for new traders!
- How to Read Stock Charts: A Guide for Beginners
- Trading Plan: 6 Steps to Create One
- How To Create a Stock Watchlist
Ready to build your watchlists? Check out these curated lists:
Once your watchlist is set, take the next step and trade with confidence using StocksToTrade’s robust platform. Don’t miss out — grab your 14-day trial for just $7 and experience the edge you need to thrive in today’s fast-paced markets.