

Haleon plc faces heightened pressure as major product safety concerns emerge, with stocks have been trading down by -13.7 percent.
Key Takeaways
- HLN has climbed from below $9.00 to around $10.00 over recent sessions, showing a steady grind higher with modest volatility.
- Daily and intraday charts for Haleon plc point to tight trading ranges, signaling accumulation rather than panic or euphoria.
- HLN’s 65% gross margin and double‑digit return on equity show a solid underlying business profile for a consumer health name.
- Valuation for Haleon plc sits in the mid‑range, with a P/E near 19 and price‑to‑sales around 2.75, suggesting neither deep discount nor extreme hype.
- Traders are watching HLN’s emerging $10 area as a short‑term decision zone for the next momentum push.
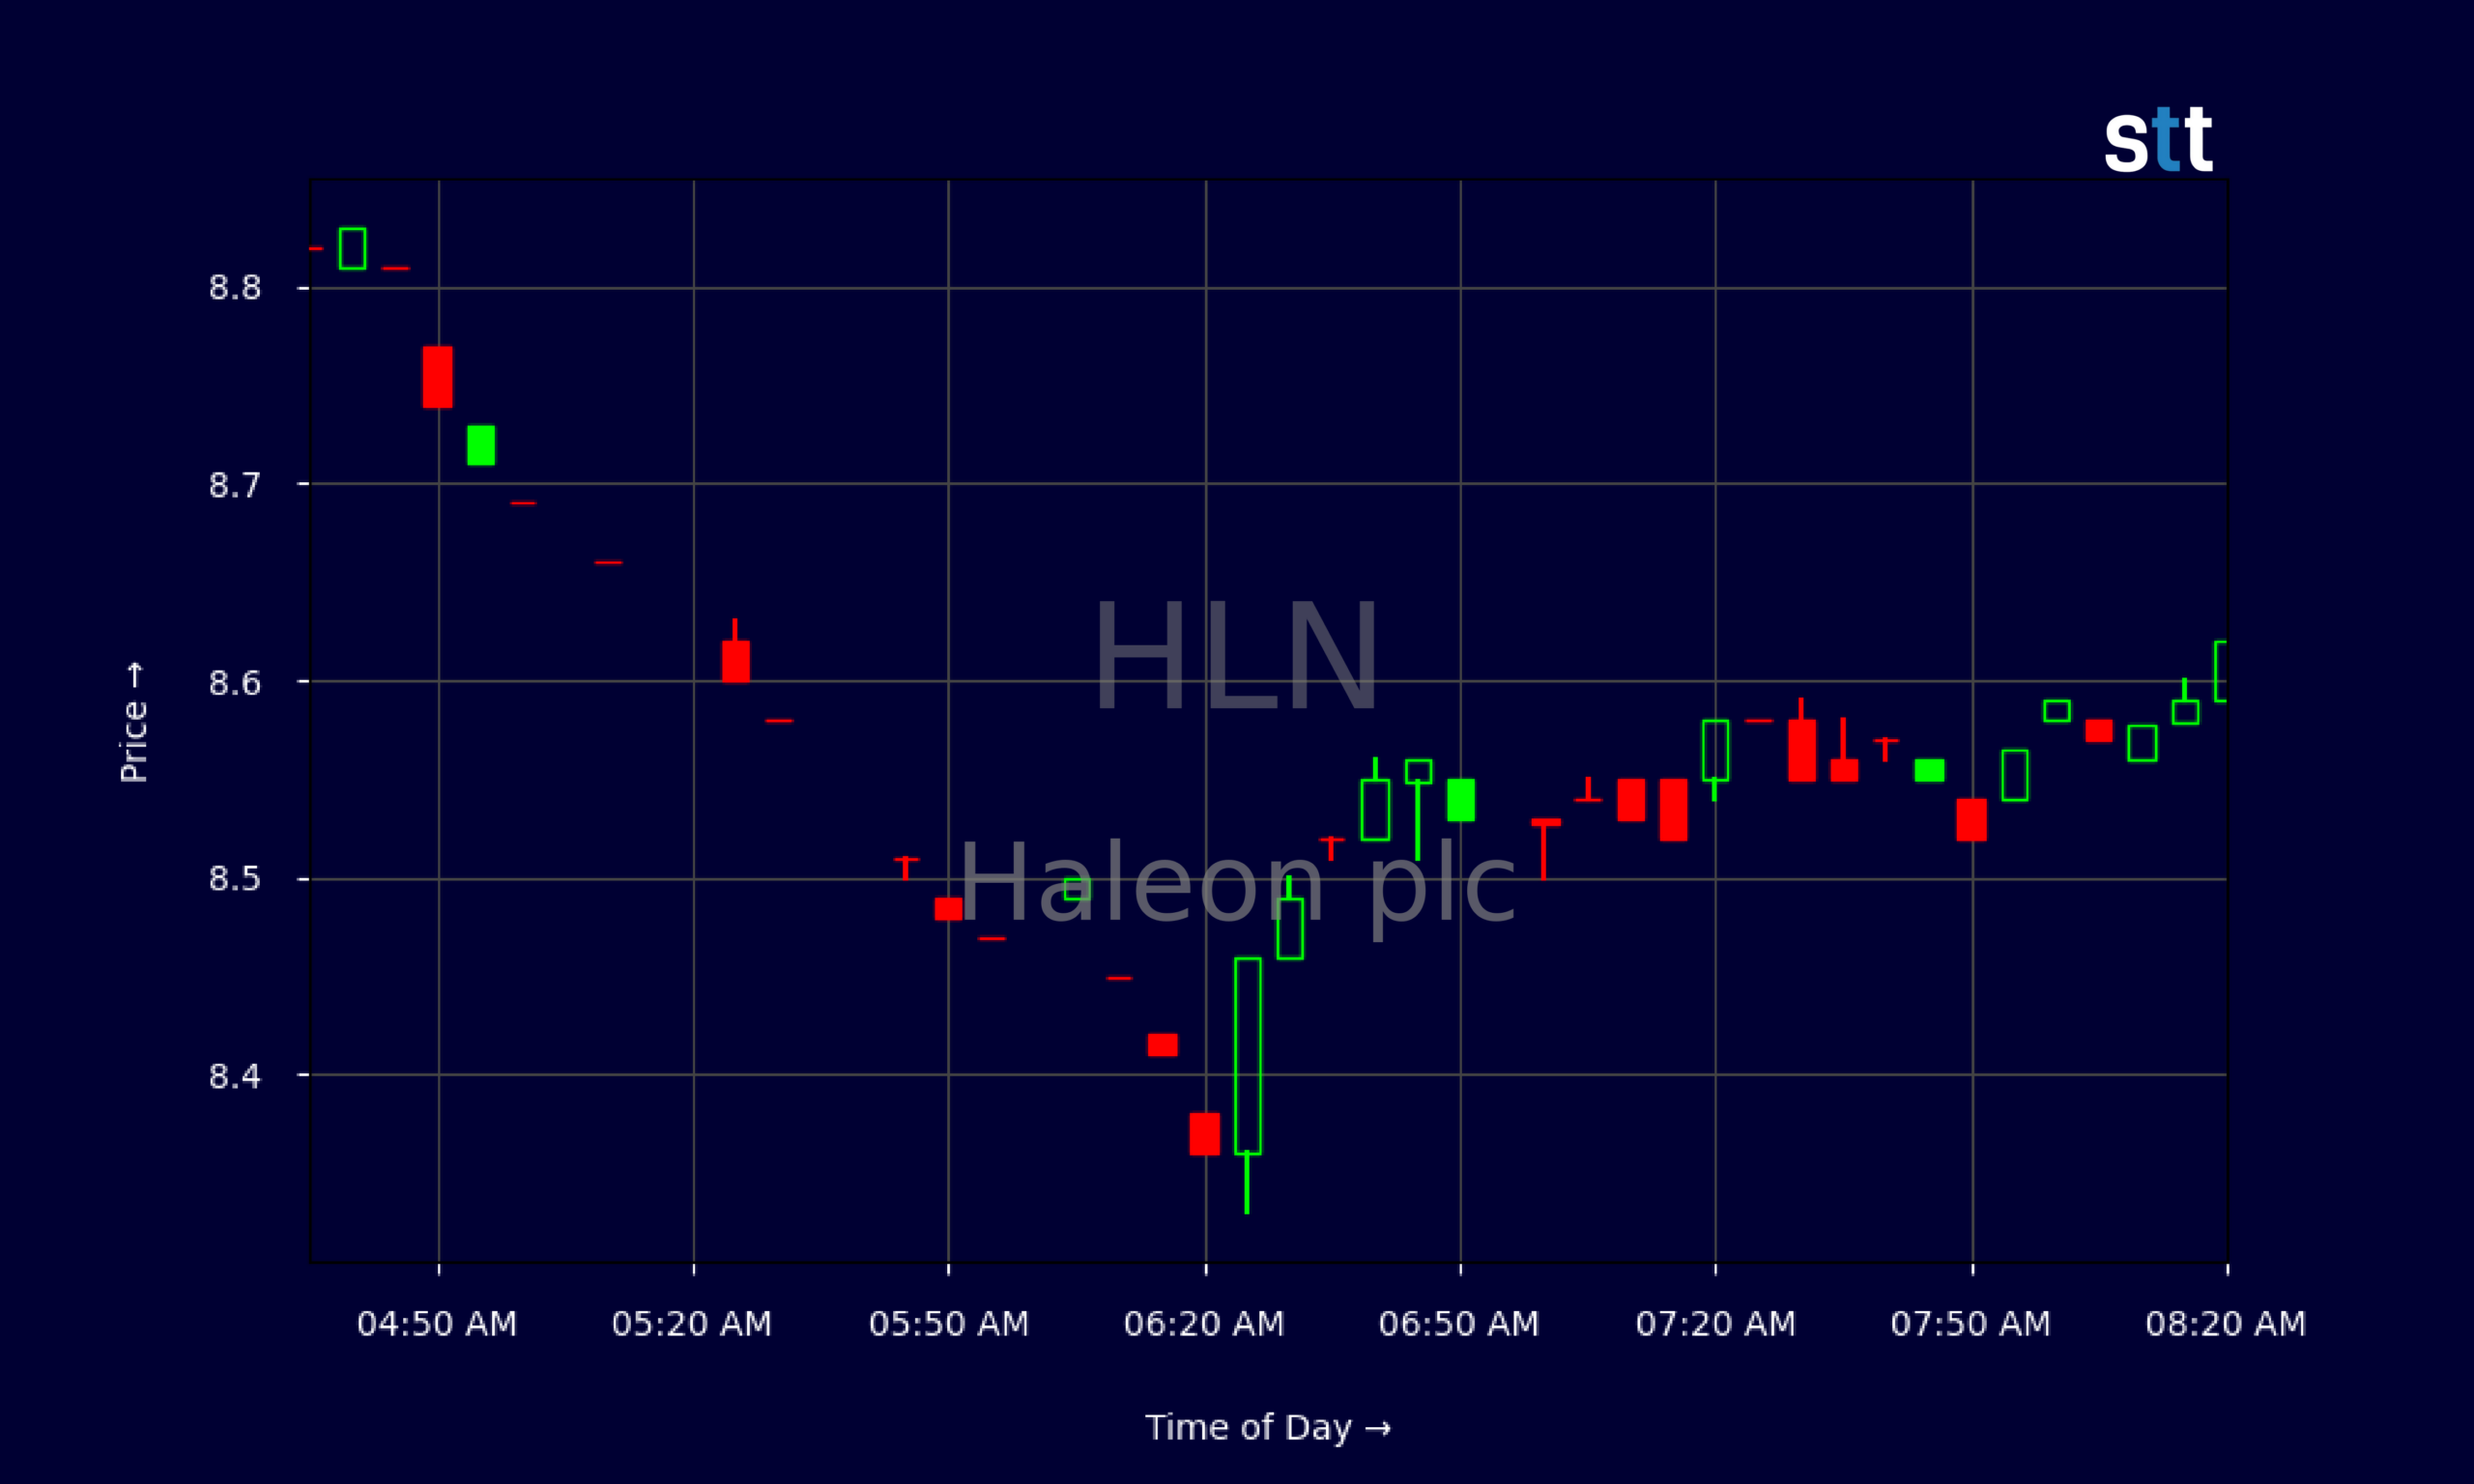
Live Update At 08:32:56 EDT: On Thursday, October 29, 2026 Haleon plc stock [NYSE: HLN] is trending down by -13.7%! Discover the key drivers behind this movement as well as our expert analysis in the detailed breakdown below.
Quick Financial Overview
HLN is not trading like a wild small cap. It’s acting like a big, steady consumer health name with real cash flow behind it. Haleon plc booked roughly $11.03B in revenue, which is serious scale. With a gross margin near 65%, HLN keeps a big slice of each dollar after product costs, a sign of strong pricing power and brand strength.
Profitability metrics back that up. EBIT margin sits around 22%, and net profit margin near 14% shows Haleon plc is not just selling a lot, it’s keeping plenty. Return on equity above 10% and a recent ROIC north of 27% tell traders HLN’s management uses capital efficiently, an underrated edge in this market.
More Breaking News
- Lumentum Holdings Jumps 17% on Marvell Purchase Talks
- NUAI Stock Rattled As Fraud Lawsuit Targets AI Pivot Claims
- ADT Stock Climbs As Oracle AI Cloud Deal Targets Savings
- Life Time Group Holdings Falls 2% Ahead of Earnings
On valuation, HLN trades at a P/E around 19.4 and price‑to‑sales of 2.75. That’s middle‑of‑the‑road for a stable consumer stock—neither a bargain‑bin turnaround nor a frothy momentum darling. Debt metrics are manageable, with total debt‑to‑equity at 0.5 and interest coverage of 8.8, though a current ratio of 0.7 reminds traders liquidity is tight, not loose. For active trading, Haleon plc offers a mix of defensive fundamentals and tradable price swings.
Why Traders Are Watching HLN’s $10 Level
The daily chart on HLN tells a clear story. Earlier in the month, Haleon plc was trading in the mid‑$8s, with a low close around $8.82 on 2026/10/05. From there, the stock started a slow but steady climb. HLN pushed through $9.00, then $9.50, then broke into the $10 handle over the last week.
That grind higher matters. HLN isn’t squeezing 20% in a day; it’s walking up stair steps. The closes moved from $8.87 to $9.32, then into the $9.50–$9.94 range, and finally to recent closes around $10.00–$10.27 for Haleon plc. Pullbacks have been shallow, with intraday lows holding near prior support instead of breaking down hard. That’s typical accumulation behavior.
The intraday 5‑minute chart backs this up. HLN showed pre‑market trading bouncing between roughly $8.45 and $8.90, then spiking as high as $9.31 before settling back just under $9.00 in one session. Tighter ranges later in the morning—8.50s to 8.60s—tell traders liquidity is there, but without runaway volatility. Haleon plc is giving clean, tradable levels, not chaotic wicks.
For short‑term traders, the $10 zone now acts as a key battleground. HLN has tested that level several times, with recent highs around $10.32 and $10.39 and closes just below or at $10.27–$10.37. If Haleon plc holds above $10 on dips, that level turns into support and opens the door for a push toward the mid‑$10s. If it fails and slips back into the high‑$9s, range trading returns. Either way, HLN’s combination of tight spreads and defined levels keeps it firmly on watchlists.
Conclusion
From a trader’s perspective, HLN offers that sweet spot many overlook: a real business with stable numbers plus enough movement to be worth day and swing trading. Haleon plc posts strong margins, solid return metrics, and a reasonable dividend yield near 1.28%, all wrapped in a valuation that doesn’t scream bubble. Those fundamentals help explain why HLN’s recent pullbacks keep getting bought and why the uptrend from the high‑$8s to around $10 has held.
On the technical side, Haleon plc is a classic “grinder.” HLN respects levels, moves in measured waves, and reacts well to support and resistance. That’s exactly the kind of price action rule‑based traders can plan around—tight risk near support, clear profit targets into prior highs. As long as HLN keeps defending higher lows on the daily chart, the path of least resistance leans upward.
Traders who follow Tim Sykes’ style will recognize the core lesson here. As Tim says, “Patterns repeat, but only if you’re prepared.” That preparation isn’t random; it comes from showing up consistently. As Tim Bohen, lead trainer with StocksToTrade says, “A consistent trading routine beats sporadic action every time. Show up daily, and you’ll start to see the patterns others miss.” HLN is building a repeatable pattern around the $10 area. Prepared traders will map their risk, wait for clean entries on Haleon plc, and stay disciplined on exits. This is educational, research‑driven trading—not guessing—and HLN is a live case study in how steady price action plus solid numbers can create opportunity.
This is stock news, not investment advice. StocksToTrade News delivers real-time stock market updates tailored to highlight the key catalysts driving short-term price movements. Our coverage is designed for active traders and investors who thrive in fast-moving markets, with a focus on volatile sectors like penny stocks, AI stocks, Robinhood stocks and other momentum plays. From earnings reports and FDA approvals to mergers, new contracts, and unusual trading volume, we break down the events that can spark significant price action.
Looking to level up your trading game? Explore StocksToTrade, the ultimate platform for traders. With powerful tools designed for swing and day trading, integrated news scanning, and even social media monitoring, StocksToTrade keeps you one step ahead.
Check out our quick startup guide for new traders!
- How to Read Stock Charts: A Guide for Beginners
- Trading Plan: 6 Steps to Create One
- How To Create a Stock Watchlist
Ready to build your watchlists? Check out these curated lists:
Once your watchlist is set, take the next step and trade with confidence using StocksToTrade’s robust platform. Don’t miss out — grab your 14-day trial for just $7 and experience the edge you need to thrive in today’s fast-paced markets.