

GMEX ROBOTICS CORPORATION faces heightened pressure as regulatory probe headlines intensify bearish sentiment; stocks have been trading down by -27.1 percent.
Market Insights For GMEX Traders
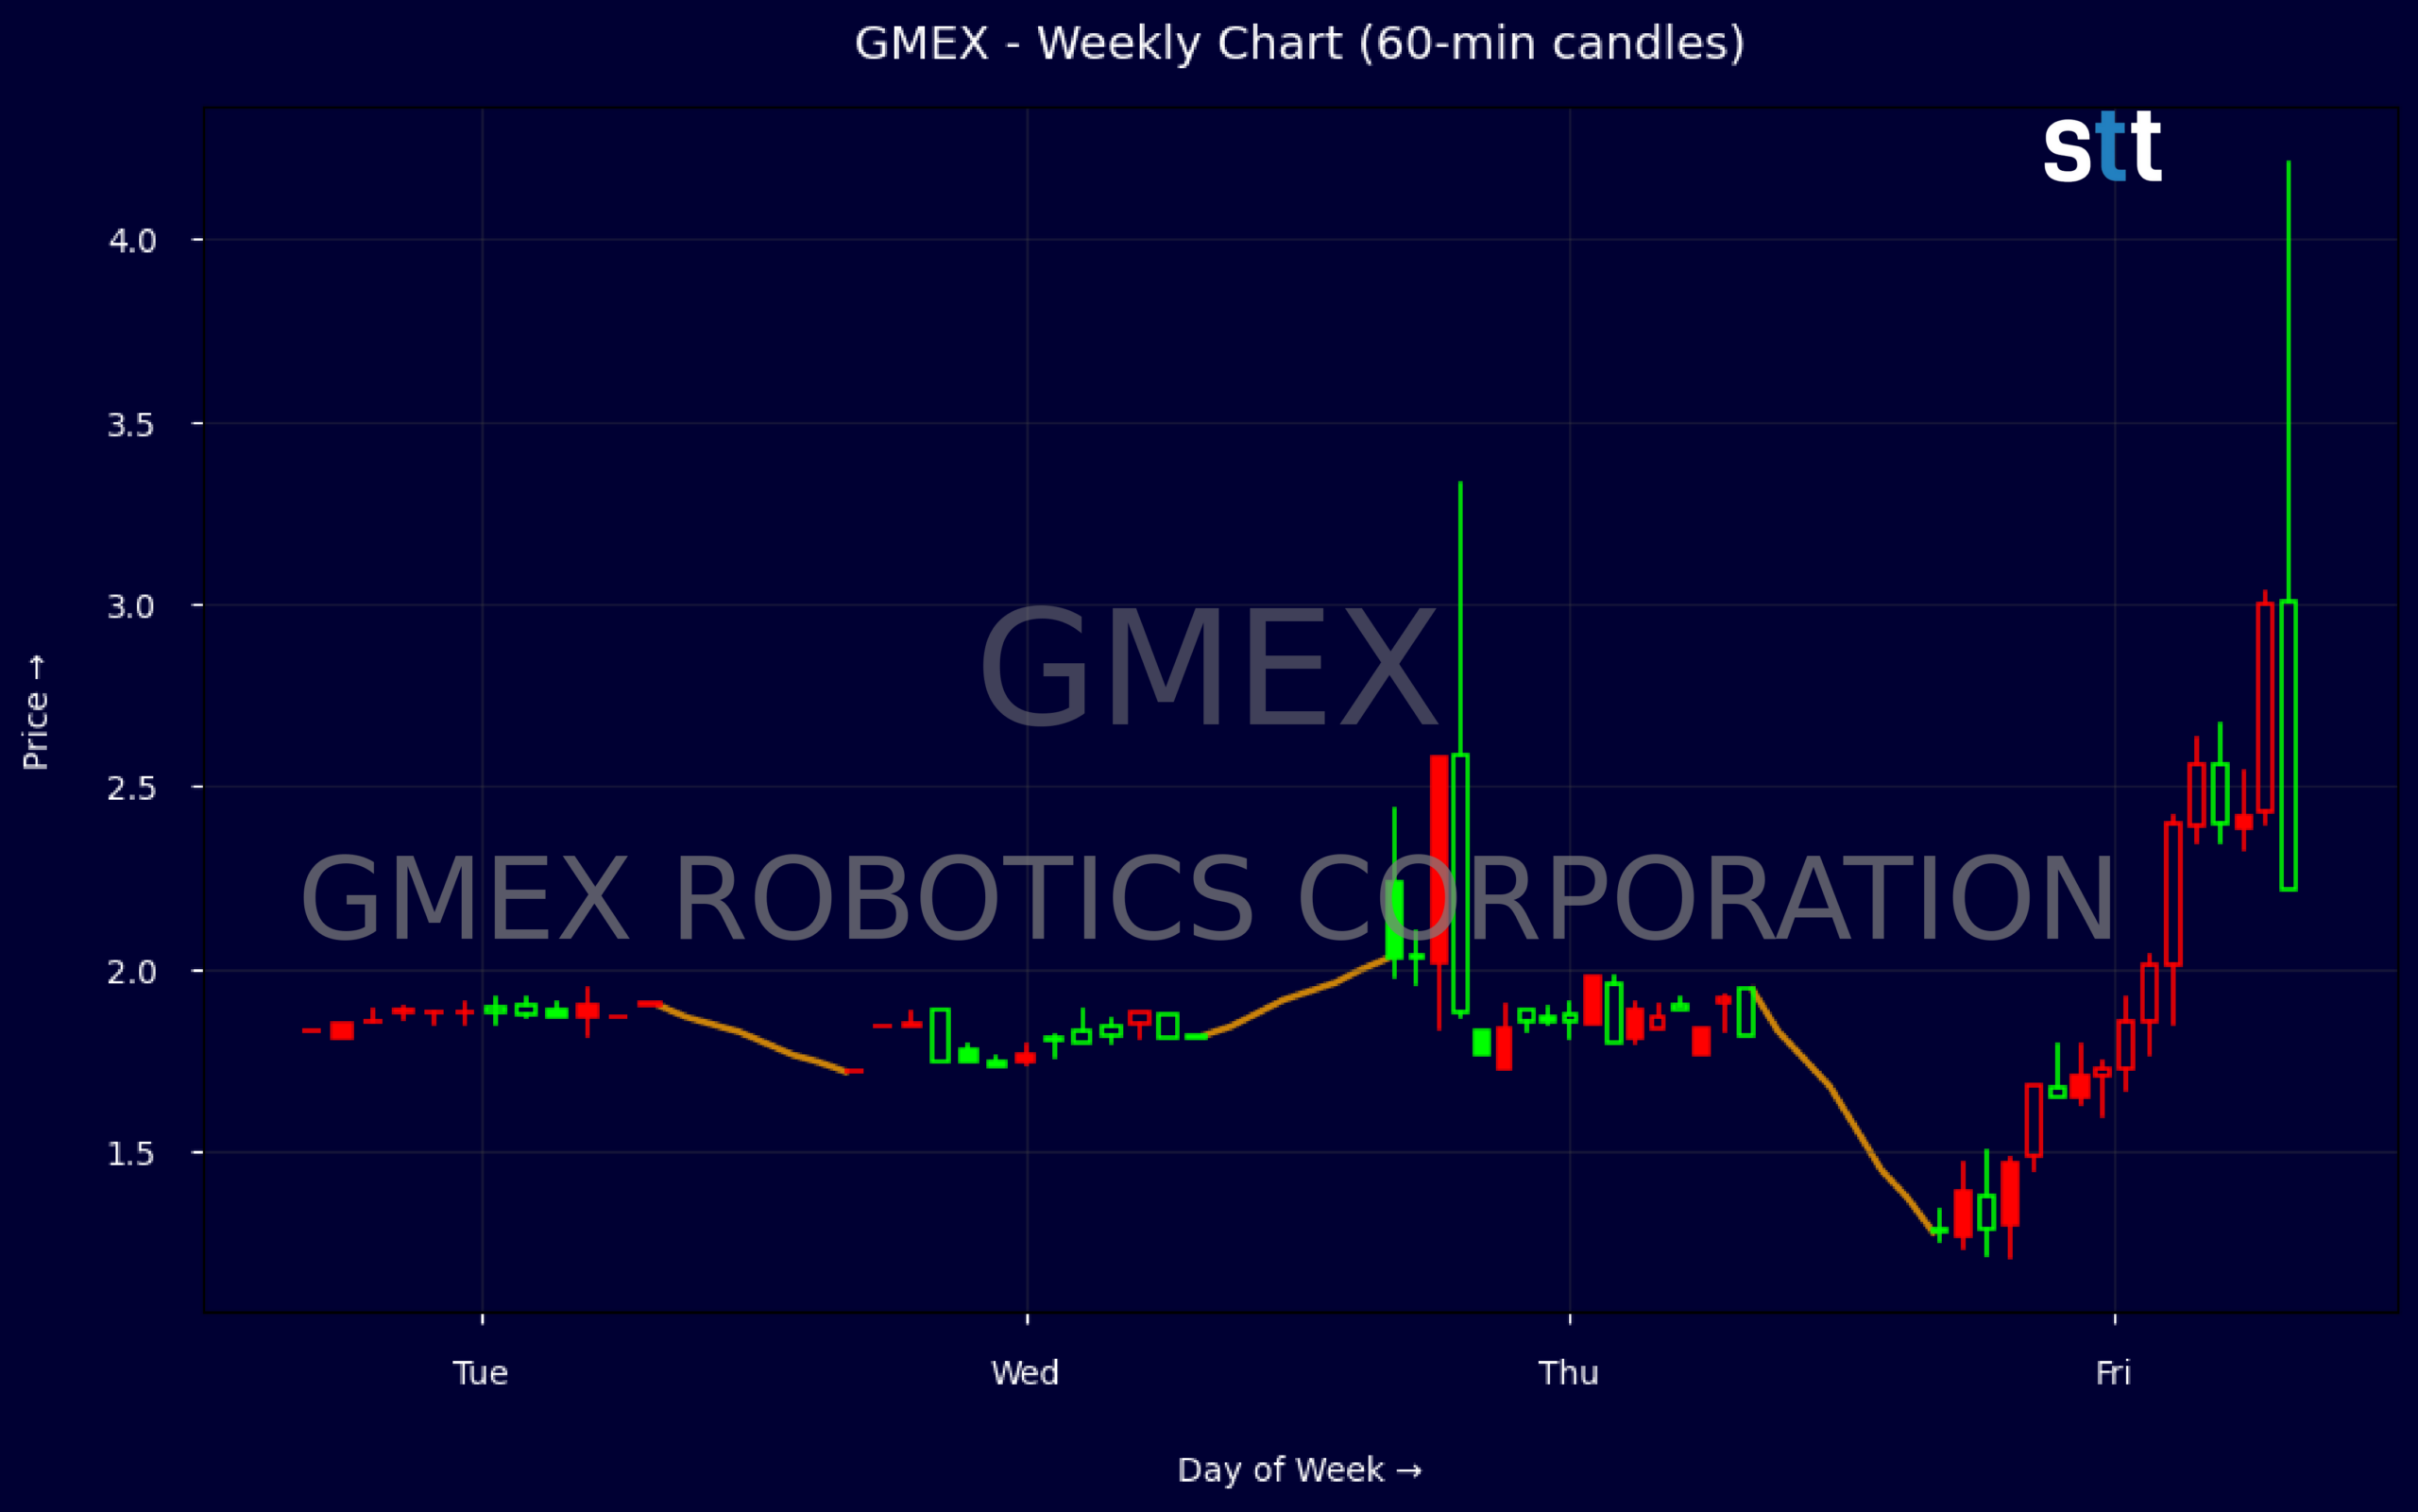
- Weekly chart for GMEX ROBOTICS CORPORATION shows a sharp round-trip from a $2.45 spike to a $1.29 close, signaling heavy volatility and sentiment swings.
- Intraday action with a $2.24 high and $1.45 low confirms wide trading ranges that can reward tight risk control and punish late chasers.
- Revenue of about $5.2M and low price-to-sales around 0.29 place GMEX in deep value territory compared to many robotics peers.
- Balance sheet with roughly $2.9M in cash and strong working capital suggests GMEX ROBOTICS CORPORATION has room to navigate near-term operations.
- Ultra-high indicated dividend metrics look distorted and should be treated with caution by traders focusing on price action rather than yield screens.
Weekly Update May 25 – May 29, 2026: On Saturday, May 30, 2026 GMEX ROBOTICS CORPORATION stock [NASDAQ: GMEX] is trending down by -27.1%! Discover the key drivers behind this movement as well as our expert analysis in the detailed breakdown below.
Consumer Discretionary industry expert:
Analyst sentiment – negative
GMEX currently screens as a deep-value, distressed small-cap with questionable sustainability. Revenue of ~$5.2M and price-to-sales of 0.29 and price-to-book of 0.17 imply the market is discounting significant business or governance risk despite positive ROIC (1.43%) and zero long-term debt. Working capital of ~$7.4M and cash of ~$2.9M versus total liabilities of ~$2.2M indicate balance-sheet solvency, but large accumulated losses (retained earnings -$10.7M) flag a challenged operating history and weak profitability.
Technically, GMEX is extremely volatile and illiquid, with weekly closes moving from 1.94 to 1.75, spiking to 2.44, then collapsing to 1.29. This profile is consistent with speculative trading rather than institutional accumulation. The dominant trend is down following a failed breakout above 2.40. Key actionable level: 1.20–1.25 as near-term support; a high-risk tactical long only makes sense on tight stops below 1.20 and confirmation via expanding volume and reclaim of 1.50 on intraday candles.
More Breaking News
- CMCSA Rises As Comcast Beats Earnings And Expands Broadband Footprint
- SPCX Slides As Headline Risk And Competition Hammer Sentiment
- GPN Rises As Global Payments Scores Wave Of Upgrades
- RKT Stock Dips After Big Q3 Earnings Beat
With no substantive news flow, GMEX trades as a micro-cap special situation well below Consumer Discretionary and Retail – Discretionary benchmarks on valuation, but also on quality and visibility. The outsized indicated dividend yield (over 700%) is clearly unsustainable and should be treated as a data anomaly or unlikely to be maintained. My verdict is Negative: this is a speculative trading vehicle, not an investable business. Resistance is 2.00–2.40, support 1.20; base-case range 1.00–1.75.
Quick Financial Overview
GMEX ROBOTICS CORPORATION sits in an interesting financial pocket for active traders. Revenue of roughly $5.2M on the latest data is modest, but the price-to-sales ratio around 0.29 and price-to-book near 0.17 flag the stock as heavily discounted relative to its stated asset base. With book value per share at 10.62 against a recent price under $3, GMEX looks like a classic deep-value robotics play in accounting terms, even if the market clearly doubts the earnings power behind those assets.
The balance sheet is a key positive point. Total assets of about $11.4M against total liabilities near $2.2M leave common equity close to $9.2M, and a leverage ratio of 1.2 stays on the conservative side for a small-cap robotics name. Cash and short-term investments around $2.9M, plus working capital over $7.4M, indicate GMEX ROBOTICS CORPORATION is not under obvious immediate balance sheet stress. That gives traders confidence that any sharp price moves are more about sentiment and expectations than survival risk.
Price action, however, shows clear uncertainty. On the weekly chart, GMEX opened at 1.94, briefly dipped to 1.72, then ripped as high as 2.45 before fading hard to close around 1.29. Intraday five-minute data confirms that volatility, with a $2.24 high and $1.45 low in a single session, pointing to aggressive momentum buying followed by just as aggressive selling. Return on invested capital near 1.43% and zero reported return on assets underline that, so far, the business has not converted its asset base into strong profitability, which helps explain why the market is hesitant to reward the stock with richer multiples.
Conclusion
GMEX Trading Outlook For Active Short-Term Players
For traders, GMEX ROBOTICS CORPORATION is currently a volatility vehicle backed by a balance sheet that appears relatively solid but earnings power that remains thin. The recent weekly spike toward $2.45 followed by a fade to the low $1 range tells you one thing clearly: sentiment on GMEX is fragile, and momentum can flip quickly. That kind of behaviour can offer strong opportunity for disciplined day traders and swing traders, while posing serious risk to anyone trading without a clear plan.
Key levels matter here. The $2.40–$2.50 zone now stands out as short-term resistance where profit-taking hit hard, while the $1.20–$1.30 band is a first support area where dip buyers stepped in. With price trading at a heavy discount to book value and sales, GMEX ROBOTICS CORPORATION screens as a deep-value robotics name, but the low returns and choppy tape remind traders that cheap can stay cheap for a long time. The way price behaves on tests of these levels will tell you whether this becomes a base-building setup or a broken momentum chart.
For educational and research purposes, traders should focus on volatility, liquidity, and execution rather than any headline story here. Manage position size tightly, respect your stops, and let the chart confirm your bias instead of guessing. As Tim Bohen, lead trainer with StocksToTrade says, “If you’re still guessing at the end of your analysis, it’s probably not a trade worth taking.”. As I often tell my students, “The edge is never in the story you tell yourself about a stock – it’s in how you manage risk around the levels that the market actually respects.”
This is stock news, not investment advice. StocksToTrade News delivers real-time stock market updates tailored to highlight the key catalysts driving short-term price movements. Our coverage is designed for active traders and investors who thrive in fast-moving markets, with a focus on volatile sectors like penny stocks, AI stocks, Robinhood stocks and other momentum plays. From earnings reports and FDA approvals to mergers, new contracts, and unusual trading volume, we break down the events that can spark significant price action.
Looking to level up your trading game? Explore StocksToTrade, the ultimate platform for traders. With powerful tools designed for swing and day trading, integrated news scanning, and even social media monitoring, StocksToTrade keeps you one step ahead.
Check out our quick startup guide for new traders!
- How to Read Stock Charts: A Guide for Beginners
- Trading Plan: 6 Steps to Create One
- How To Create a Stock Watchlist
Ready to build your watchlists? Check out these curated lists:
Once your watchlist is set, take the next step and trade with confidence using StocksToTrade’s robust platform. Don’t miss out — grab your 14-day trial for just $7 and experience the edge you need to thrive in today’s fast-paced markets.