

FuelCell Energy Inc. stocks have been trading up by 11.81 percent amid upbeat sentiment on its clean energy growth prospects.
What Traders Need To Know
- A recent Form 4 filing reports a change in beneficial ownership of FuelCell Energy (FCEL) securities by an insider or major holder.
- The filing does not specify the size of the transaction, whether it was a purchase or sale, or any contextual details about the change in ownership.
- Recent weekly action shows FCEL swinging between $12.00 and $13.83, signaling active short-term trading interest.
- Intraday, a 5-minute bar ranging from $12.30 to $13.97 and closing near the highs highlights strong upside momentum during the latest push.
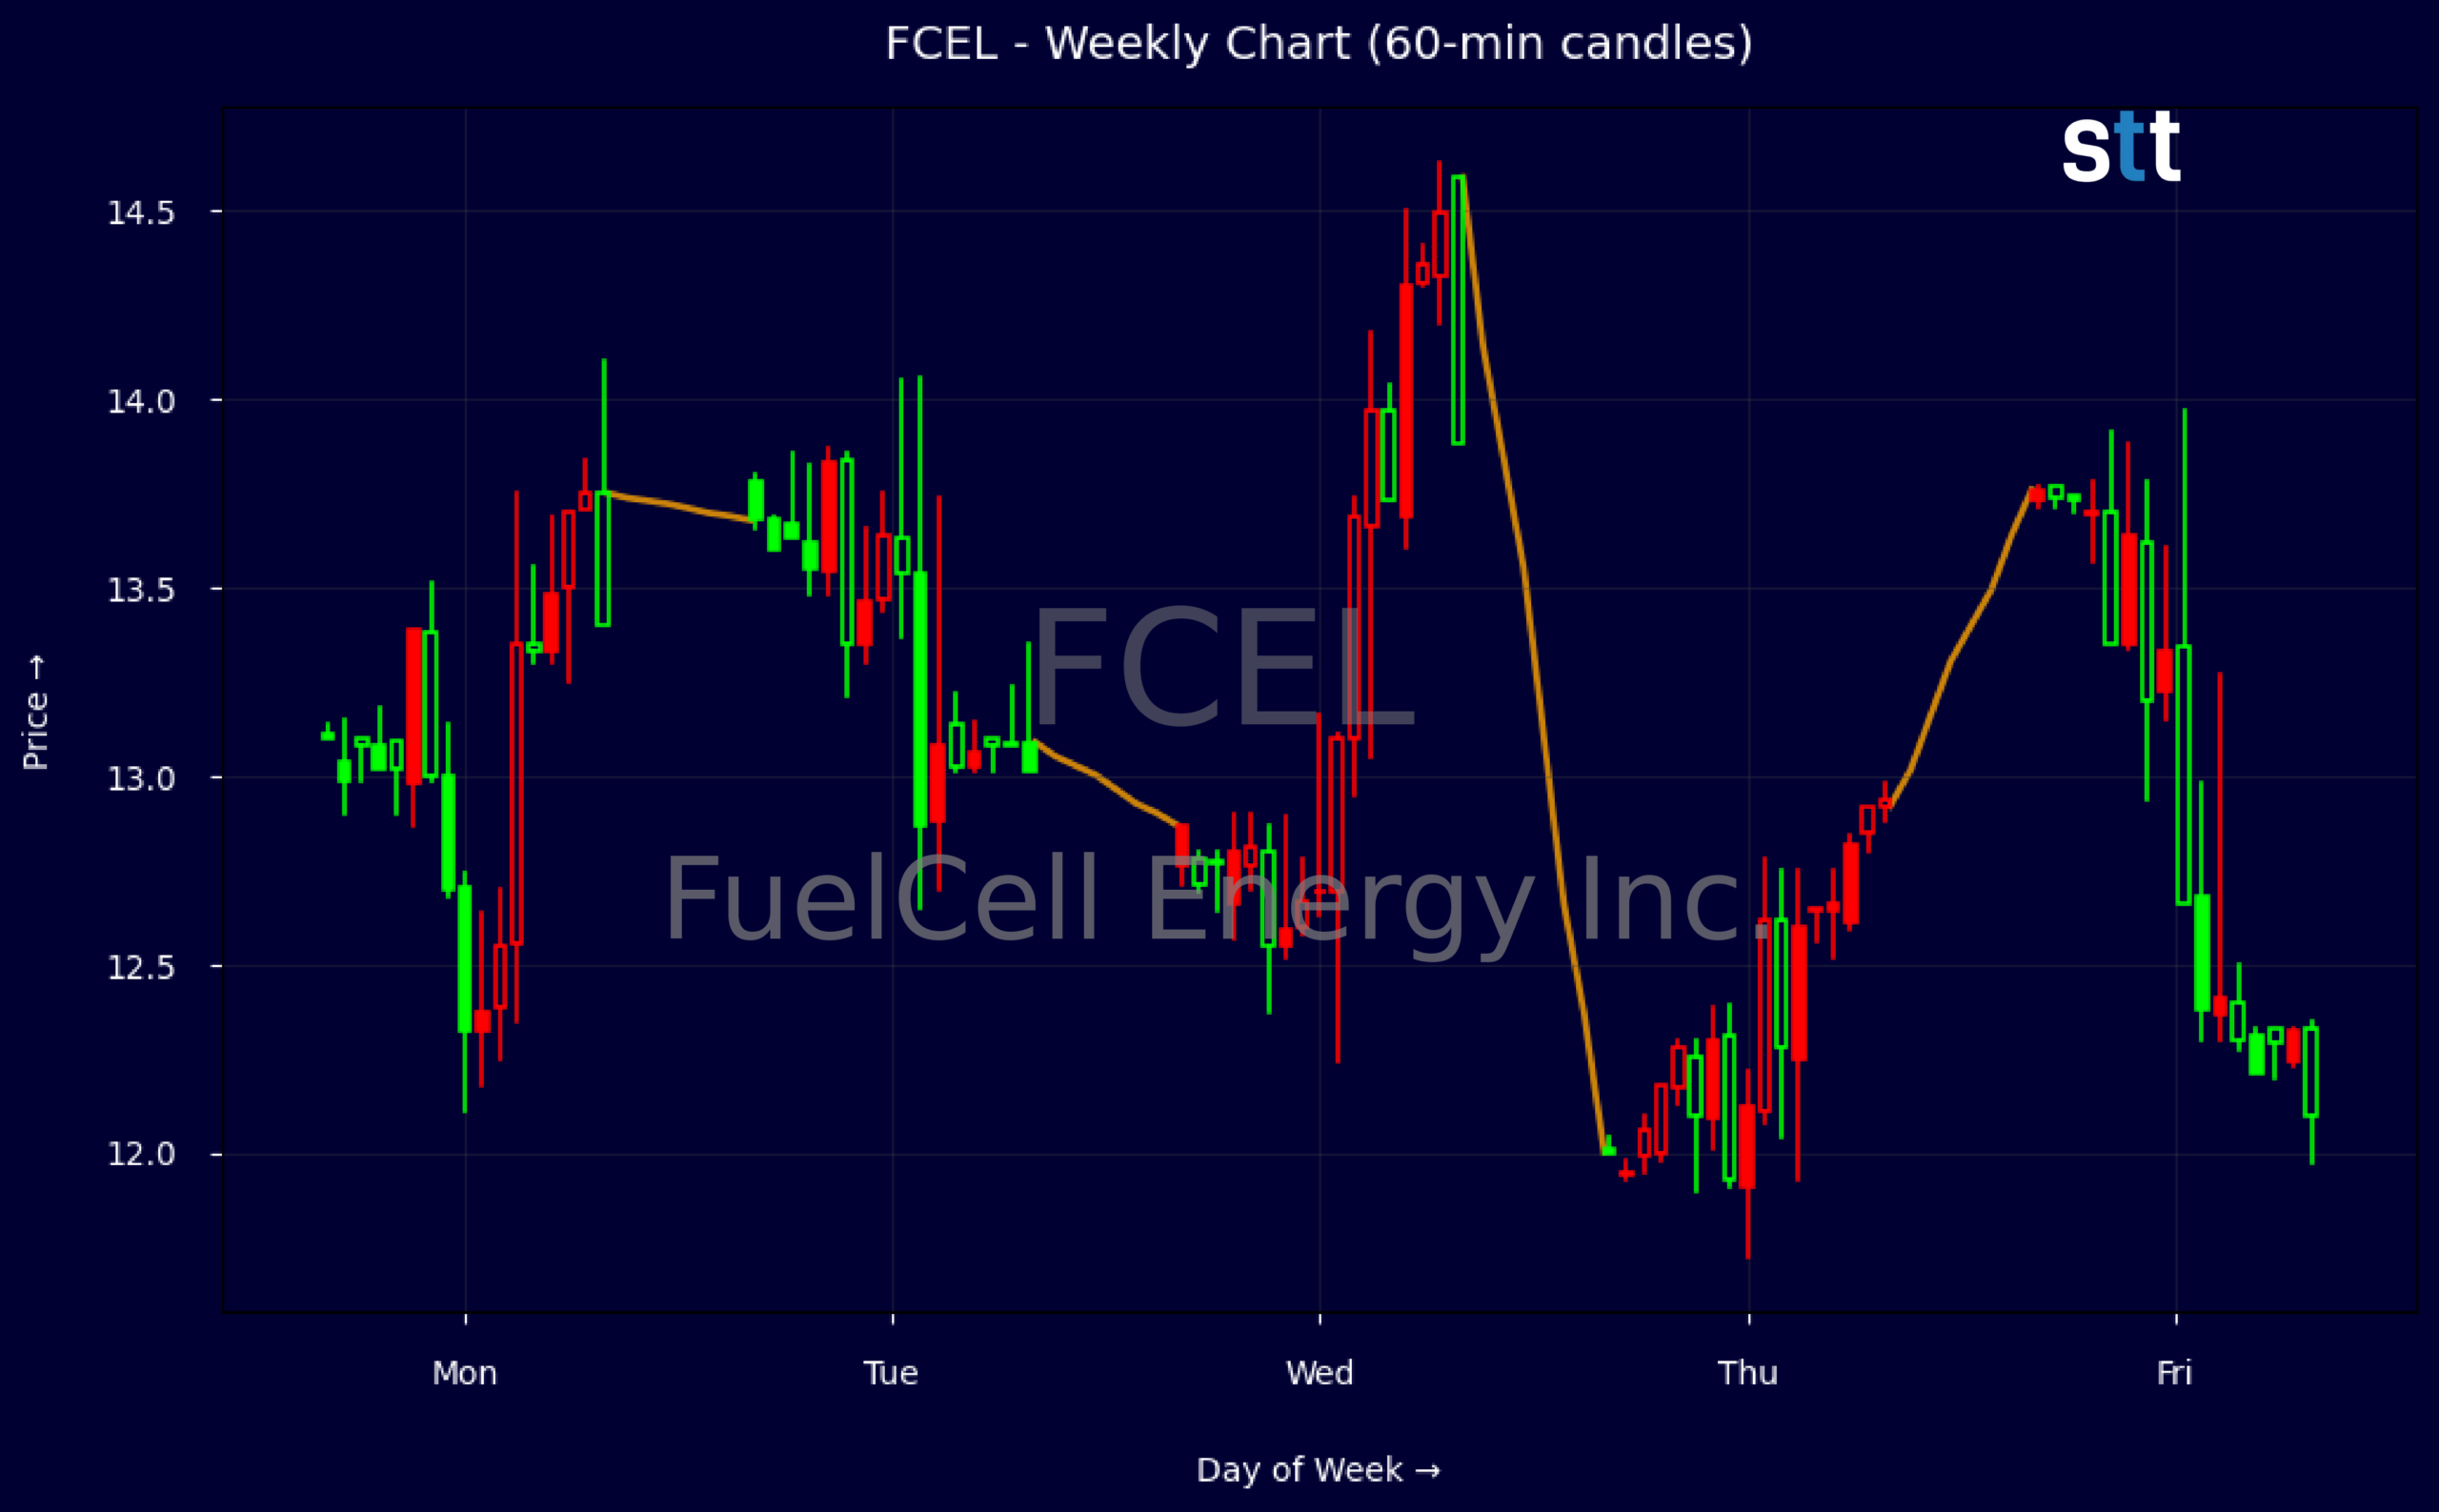
Weekly Update May 04 – May 08, 2026: On Saturday, May 09, 2026 FuelCell Energy Inc. stock [NASDAQ: FCEL] is trending up by 11.81%! Discover the key drivers behind this movement as well as our expert analysis in the detailed breakdown below.
Industrials industry expert:
Analyst sentiment – negative
FuelCell Energy holds a niche position in stationary fuel-cell power, but fundamentals are weak and equity remains highly speculative. Revenue of ~$158m with strong multi‑year growth (3‑yr CAGR ~38%) contrasts with deeply negative profitability (gross margin –16%, profit margin about –109%) and ROE around –24–28%. Despite low leverage (total debt/equity 0.04, current ratio 8.0) and ample cash (~$312m), operations burn cash (Q1 FCF –$34.7m) and rely on equity/debt financing, justifying the sub‑1.0x P/B and rich ~3.8x P/S for a loss‑maker.
Weekly data show a choppy, range‑bound pattern between roughly $12.00 and $13.80, with sharp reversals suggesting short‑term traders dominating. The recent spike from $12.21 to $13.73, likely on elevated intraday volume, pushed price back toward the upper band but without evidence of sustained accumulation in 5‑minute candles. Dominant trend remains sideways to slightly negative on a higher‑timeframe basis. The key actionable level is resistance at $13.80–14.00; short‑biased traders can lean against that zone with stops above $14.25.
More Breaking News
- No Analysis Provided
- CareDx CDNA Soars After Earnings Beat And Guidance Hike
- NCPL Plunges As SEC Fraud Charges Ignite Legal Firestorm
- Micron Stock Slides As China’s CXMT DRAM Threat Rattles Traders
The recent Form 4 activity, absent size or direction detail, is not a major catalyst; it mainly highlights ongoing insider portfolio management rather than strategic change. Relative to broader Industrials and Industrial Goods, FCEL lags significantly on returns and profitability, trading more as a long‑duration hydrogen/fuel‑cell option than an operating compounder. Base‑case stance is underweight with a high‑risk profile; near‑term support sits around $12.00, resistance $14.00, implying a tactical trading range of $12–14 until clear margin and order‑book progress emerges.
Quick Financial Overview
FuelCell Energy Inc. is showing active short-term volatility, with weekly closes bouncing between roughly the low-$12s and high-$13s. The stock dropped from about $13.81 to $12.21, then snapped back toward $13.73, telling traders this is a two-sided tape with fast rotations. The intraday 5‑minute candle that ran from around $12.30 to $13.97 and closed near $13.70 reinforces that buyers can take control quickly when volume steps in.
On the fundamental side, FuelCell Energy Inc. generated about $158.16M in revenue, but margins remain pressured. Gross margin is about -16%, and total profit margin is deeply negative, which means the core business is still losing money even as EBITDA margin appears positive. For traders, that usually caps how far sentiment can stretch without clear evidence of sustained revenue or margin improvement.
Liquidity is a key offset here. FCEL reports a current ratio near 8 and low total debt to equity around 0.04, supported by roughly $311.8M in cash and equivalents on the balance sheet. Operating cash flow is still negative at about -$33.94M for the quarter, with free cash flow around -$34.71M, funded largely by financing cash inflows. Valuation sits near 0.94x book value and about 3.83x sales, suggesting the market is not paying a premium and is waiting for proof of execution.
Conclusion
The latest Form 4 filing around FuelCell Energy Inc. signals insider or major-holder activity but, without detail on size or direction, it is not a clean trading signal by itself. Traders should see it as a prompt to check the actual filing, then cross‑reference any trade size and price with recent ranges between about $12.00 and $13.83. Price is respecting that band for now, with sharp intraday spikes such as the move from near $12.30 to almost $14.00 showing how quickly FCEL can expand its range.
Financially, FuelCell Energy Inc. still faces real earnings and cash flow pressure, even though the balance sheet shows strong liquidity and modest leverage. That mix creates a classic speculative profile: room to maneuver, but no confirmed fundamental turn yet. For short-term traders, the key is to treat rallies toward the upper-$13s as potential reaction zones and watch how volume behaves if price pushes through or rejects those highs. In that context, the discipline not to get sucked into emotional entries is crucial. As Tim Bohen, lead trainer with StocksToTrade says, “I never chase price. The best opportunities allow me to enter on my terms, not when I’m feeling pressured.” That mindset is especially relevant when FCEL is making fast moves within or beyond this range band.
This remains a research-driven trade, not a blind bet. As I tell my students, “You do not trade a story, you trade the levels, the numbers, and the tape — and you size every FCEL position as if the story could change overnight.””,”scores”:{“risk-level”:”high”},”trade”:”false\”
This is stock news, not investment advice. StocksToTrade News delivers real-time stock market updates tailored to highlight the key catalysts driving short-term price movements. Our coverage is designed for active traders and investors who thrive in fast-moving markets, with a focus on volatile sectors like penny stocks, AI stocks, Robinhood stocks and other momentum plays. From earnings reports and FDA approvals to mergers, new contracts, and unusual trading volume, we break down the events that can spark significant price action.
Looking to level up your trading game? Explore StocksToTrade, the ultimate platform for traders. With powerful tools designed for swing and day trading, integrated news scanning, and even social media monitoring, StocksToTrade keeps you one step ahead.
Check out our quick startup guide for new traders!
- How to Read Stock Charts: A Guide for Beginners
- Trading Plan: 6 Steps to Create One
- How To Create a Stock Watchlist
Ready to build your watchlists? Check out these curated lists:
Once your watchlist is set, take the next step and trade with confidence using StocksToTrade’s robust platform. Don’t miss out — grab your 14-day trial for just $7 and experience the edge you need to thrive in today’s fast-paced markets.