
Freight Technologies Inc. stocks have been trading down by -9.03 percent amid heightened concerns over weakened freight demand and pricing.
Click Here for a Millionaire's POV on Trading FRGT
SUBSCRIBE FOR ALERTSJOIN 50,000+ ACTIVE TRADERS
Key Takeaways
- Price action in FRGT shows a massive intraday spike from sub-$0.30 levels into the $2 area before pulling back, signaling aggressive momentum trading.
- Recent daily candles highlight extreme volatility in Freight Technologies Inc., with repeated gap moves and wide intraday ranges that appeal to short-term traders.
- Key ratios show a tiny enterprise value near $3.3M, underscoring how quickly sentiment and liquidity can swing FRGT.
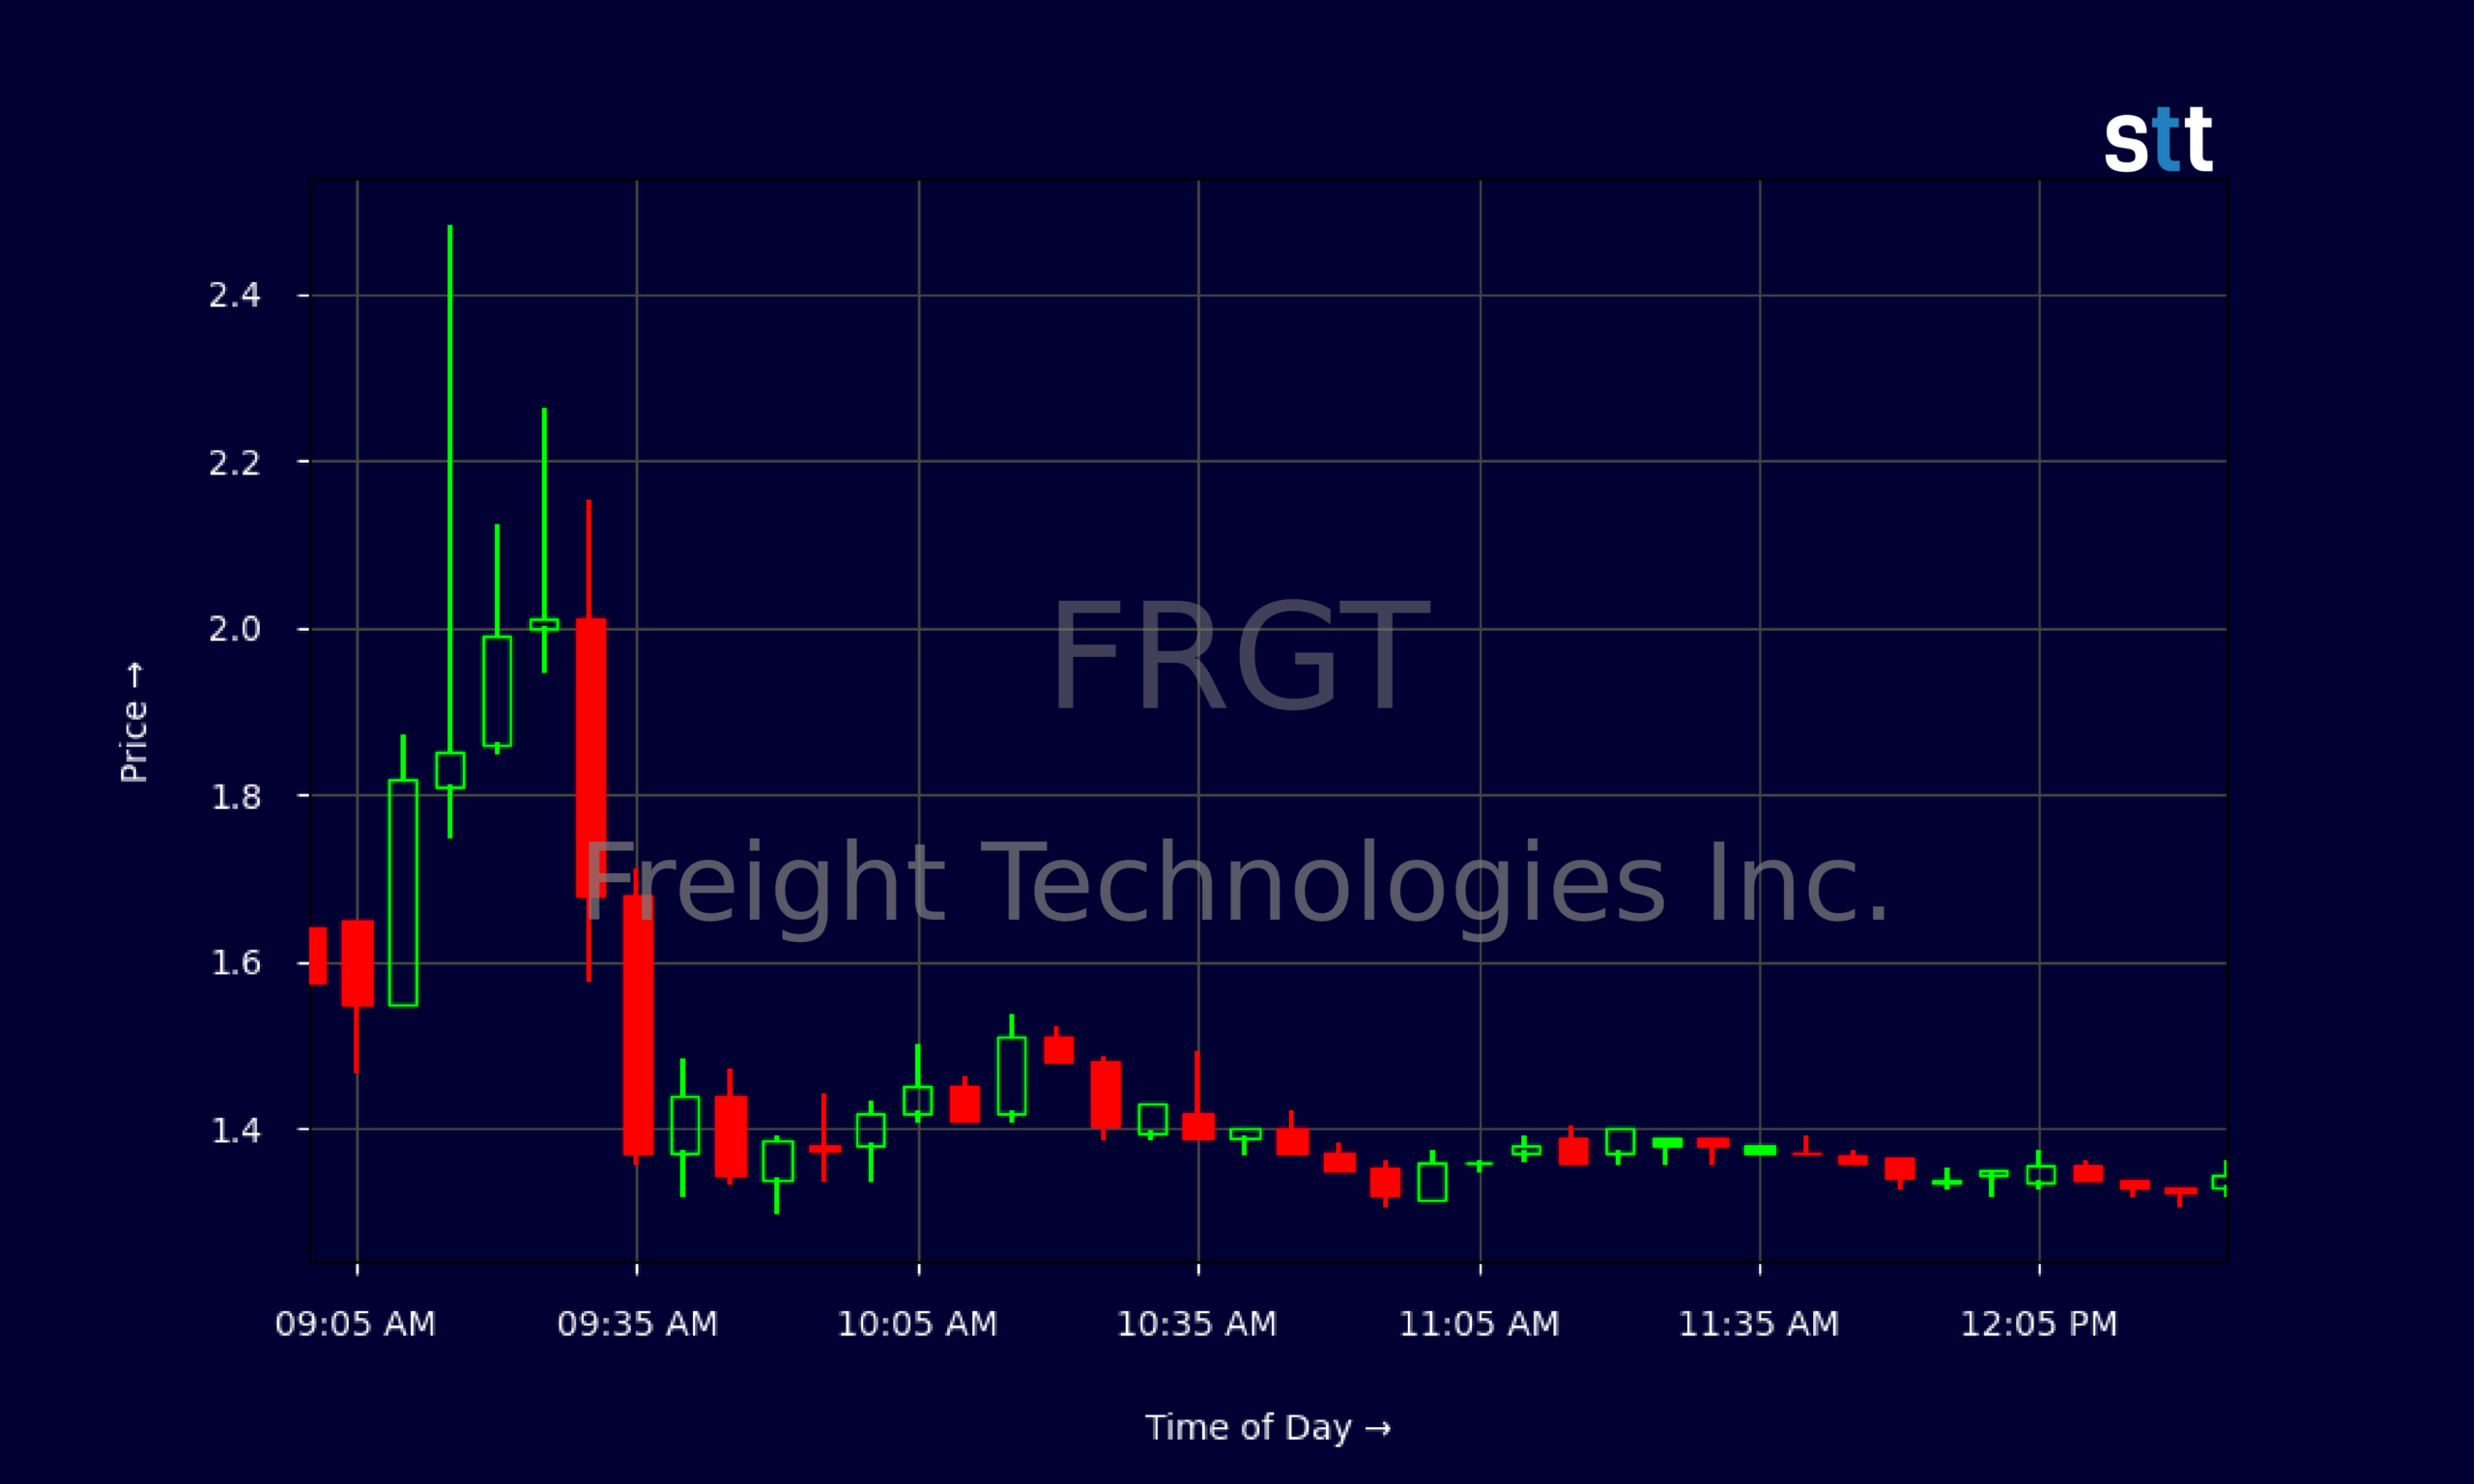
- Intraday five‑minute chart now shows tighter consolidation around $1.30–$1.40, giving traders clearer risk levels after the morning chaos.
Live Update At 12:32:00 EDT: On Monday, October 19, 2026 Freight Technologies Inc. stock [NASDAQ: FRGT] is trending down by -9.03%! Discover the key drivers behind this movement as well as our expert analysis in the detailed breakdown below.
Quick Financial Overview
Freight Technologies Inc. is trading like a classic low‑float momentum name. The daily chart on FRGT shows the stock was grinding below $0.50 for days, then suddenly exploded to a high above $2. This kind of move is usually driven by a thin supply of shares and day traders piling in, not by slow, fundamental changes. For active trading, that difference matters.
On the fundamental side, the available key ratios are sparse. What we do see is an enterprise value around $3.34M. For FRGT, that’s very small, which often goes hand in hand with sharp, news‑sensitive swings. There’s no clear profitability data or revenue trends listed, so traders are flying more by chart than by balance sheet.
More Breaking News
- Nebius Group NBIS Extends AI Cloud Lead With Inferize Deal
- APLD Stock Pops As AI Factory Earnings Crush Expectations
- ALM Stock Pullback Puts High-Price Valuation In Focus
- CoreWeave Stock Slides As Debt Fears Clash With India AI Expansion
Recent closes show FRGT sliding from the $0.40 area into the $0.20s, then suddenly launching into the $2 range before closing near $1.35. That intraday range alone tells traders one thing: this is a rollercoaster. Risk management and position sizing become more important than any single technical line when a stock can lose or gain 50% in minutes.
Why Traders Are Watching FRGT’s Momentum
FRGT has grabbed traders’ attention for one main reason: volatility. The daily chart of Freight Technologies Inc. shows a clear shift from slow, choppy trading around $0.25–$0.40 to a violent breakout day. On 2026/10/19, FRGT opened near $2.01, ripped to $2.15, and then flushed all the way down to $1.30 before closing at $1.35. Moves like that don’t go unnoticed in the small‑cap trading world.
The five‑minute chart adds more detail. FRGT spiked hard out of the premarket, hit the mid‑$2s, then quickly broke down through $2 and $1.80, and eventually traded in the $1.30–$1.40 zone. After the initial spike and dump, Freight Technologies Inc. started to tighten up, with candles clustering around $1.33–$1.40. That type of consolidation after a huge move is exactly what momentum traders watch for potential secondary moves.
For short‑term traders, FRGT is now a textbook case of a recent runner trying to find a new equilibrium. The $2 area stands out as clear overhead resistance from the morning high and early fade. The low $1.30s are shaping up as an intraday support band where dip buyers previously stepped in. Every test of those levels on Freight Technologies Inc. gives clues about whether the next move is another squeeze higher or a full fade back toward the prior sub‑$0.50 range.
Conclusion
FRGT is not trading like a quiet, fundamentally driven freight‑tech name right now. Freight Technologies Inc. is acting like a pure momentum play, with the chart leading the story. A tiny enterprise value near $3.3M and the lack of visible profitability metrics tell traders they’re dealing with a speculative small cap where sentiment and liquidity rule the day. That’s not good or bad by itself, but it demands discipline.
For day traders, the key is to treat FRGT as a short‑term trading vehicle, not a long‑term thesis. The big breakout from under $0.30 into the $2 range has now cooled into consolidation around $1.30–$1.40. If FRGT holds above that band and starts pushing back through $1.80 and $2, momentum traders are likely to refocus on it. If it loses $1.30 with volume, the chart opens up for a deeper pullback.
As Tim Sykes likes to remind his students, “Volatility is opportunity if you’re prepared, danger if you’re not.” FRGT embodies that message right now. As Tim Bohen, lead trainer with StocksToTrade says, “I never chase price. The best opportunities allow me to enter on my terms, not when I’m feeling pressured.” Freight Technologies Inc. offers range, liquidity, and clean levels, but it also punishes late chasers and stubborn bagholders. For educational and research purposes, this is the type of chart traders should study closely to learn how explosive small‑cap moves build, peak, and unwind.
This is stock news, not investment advice. StocksToTrade News delivers real-time stock market updates tailored to highlight the key catalysts driving short-term price movements. Our coverage is designed for active traders and investors who thrive in fast-moving markets, with a focus on volatile sectors like penny stocks, AI stocks, Robinhood stocks and other momentum plays. From earnings reports and FDA approvals to mergers, new contracts, and unusual trading volume, we break down the events that can spark significant price action.
Looking to level up your trading game? Explore StocksToTrade, the ultimate platform for traders. With powerful tools designed for swing and day trading, integrated news scanning, and even social media monitoring, StocksToTrade keeps you one step ahead.
Check out our quick startup guide for new traders!
- How to Read Stock Charts: A Guide for Beginners
- Trading Plan: 6 Steps to Create One
- How To Create a Stock Watchlist
Ready to build your watchlists? Check out these curated lists:
Once your watchlist is set, take the next step and trade with confidence using StocksToTrade’s robust platform. Don’t miss out — grab your 14-day trial for just $7 and experience the edge you need to thrive in today’s fast-paced markets.