Founder Group Limited faces intensified scrutiny over debt restructuring, with stocks have been trading down by -42.51 percent.
Click Here for a Millionaire's POV on Trading FGL
SUBSCRIBE FOR ALERTSJOIN 50,000+ ACTIVE TRADERS
Market Insights For Active FGL Traders
- Recent weekly action shows FGL spiking above 3.00 then fading hard toward 1.65, signaling aggressive profit taking and weak follow-through.
- Intraday range from 2.79 down to 1.60 highlights elevated volatility that short-term traders can exploit but must manage with tight risk.
- Revenue of about $120.7M against a modest enterprise value near $13.2M keeps valuation compressed and sensitive to sentiment swings.
- Balance sheet shows $80.2M in cash and positive working capital, giving Founder Group Limited room to navigate while traders focus on price structure.
- Low price-to-sales and price-to-book ratios make FGL a classic value-plus-volatility setup that rewards disciplined trade planning.
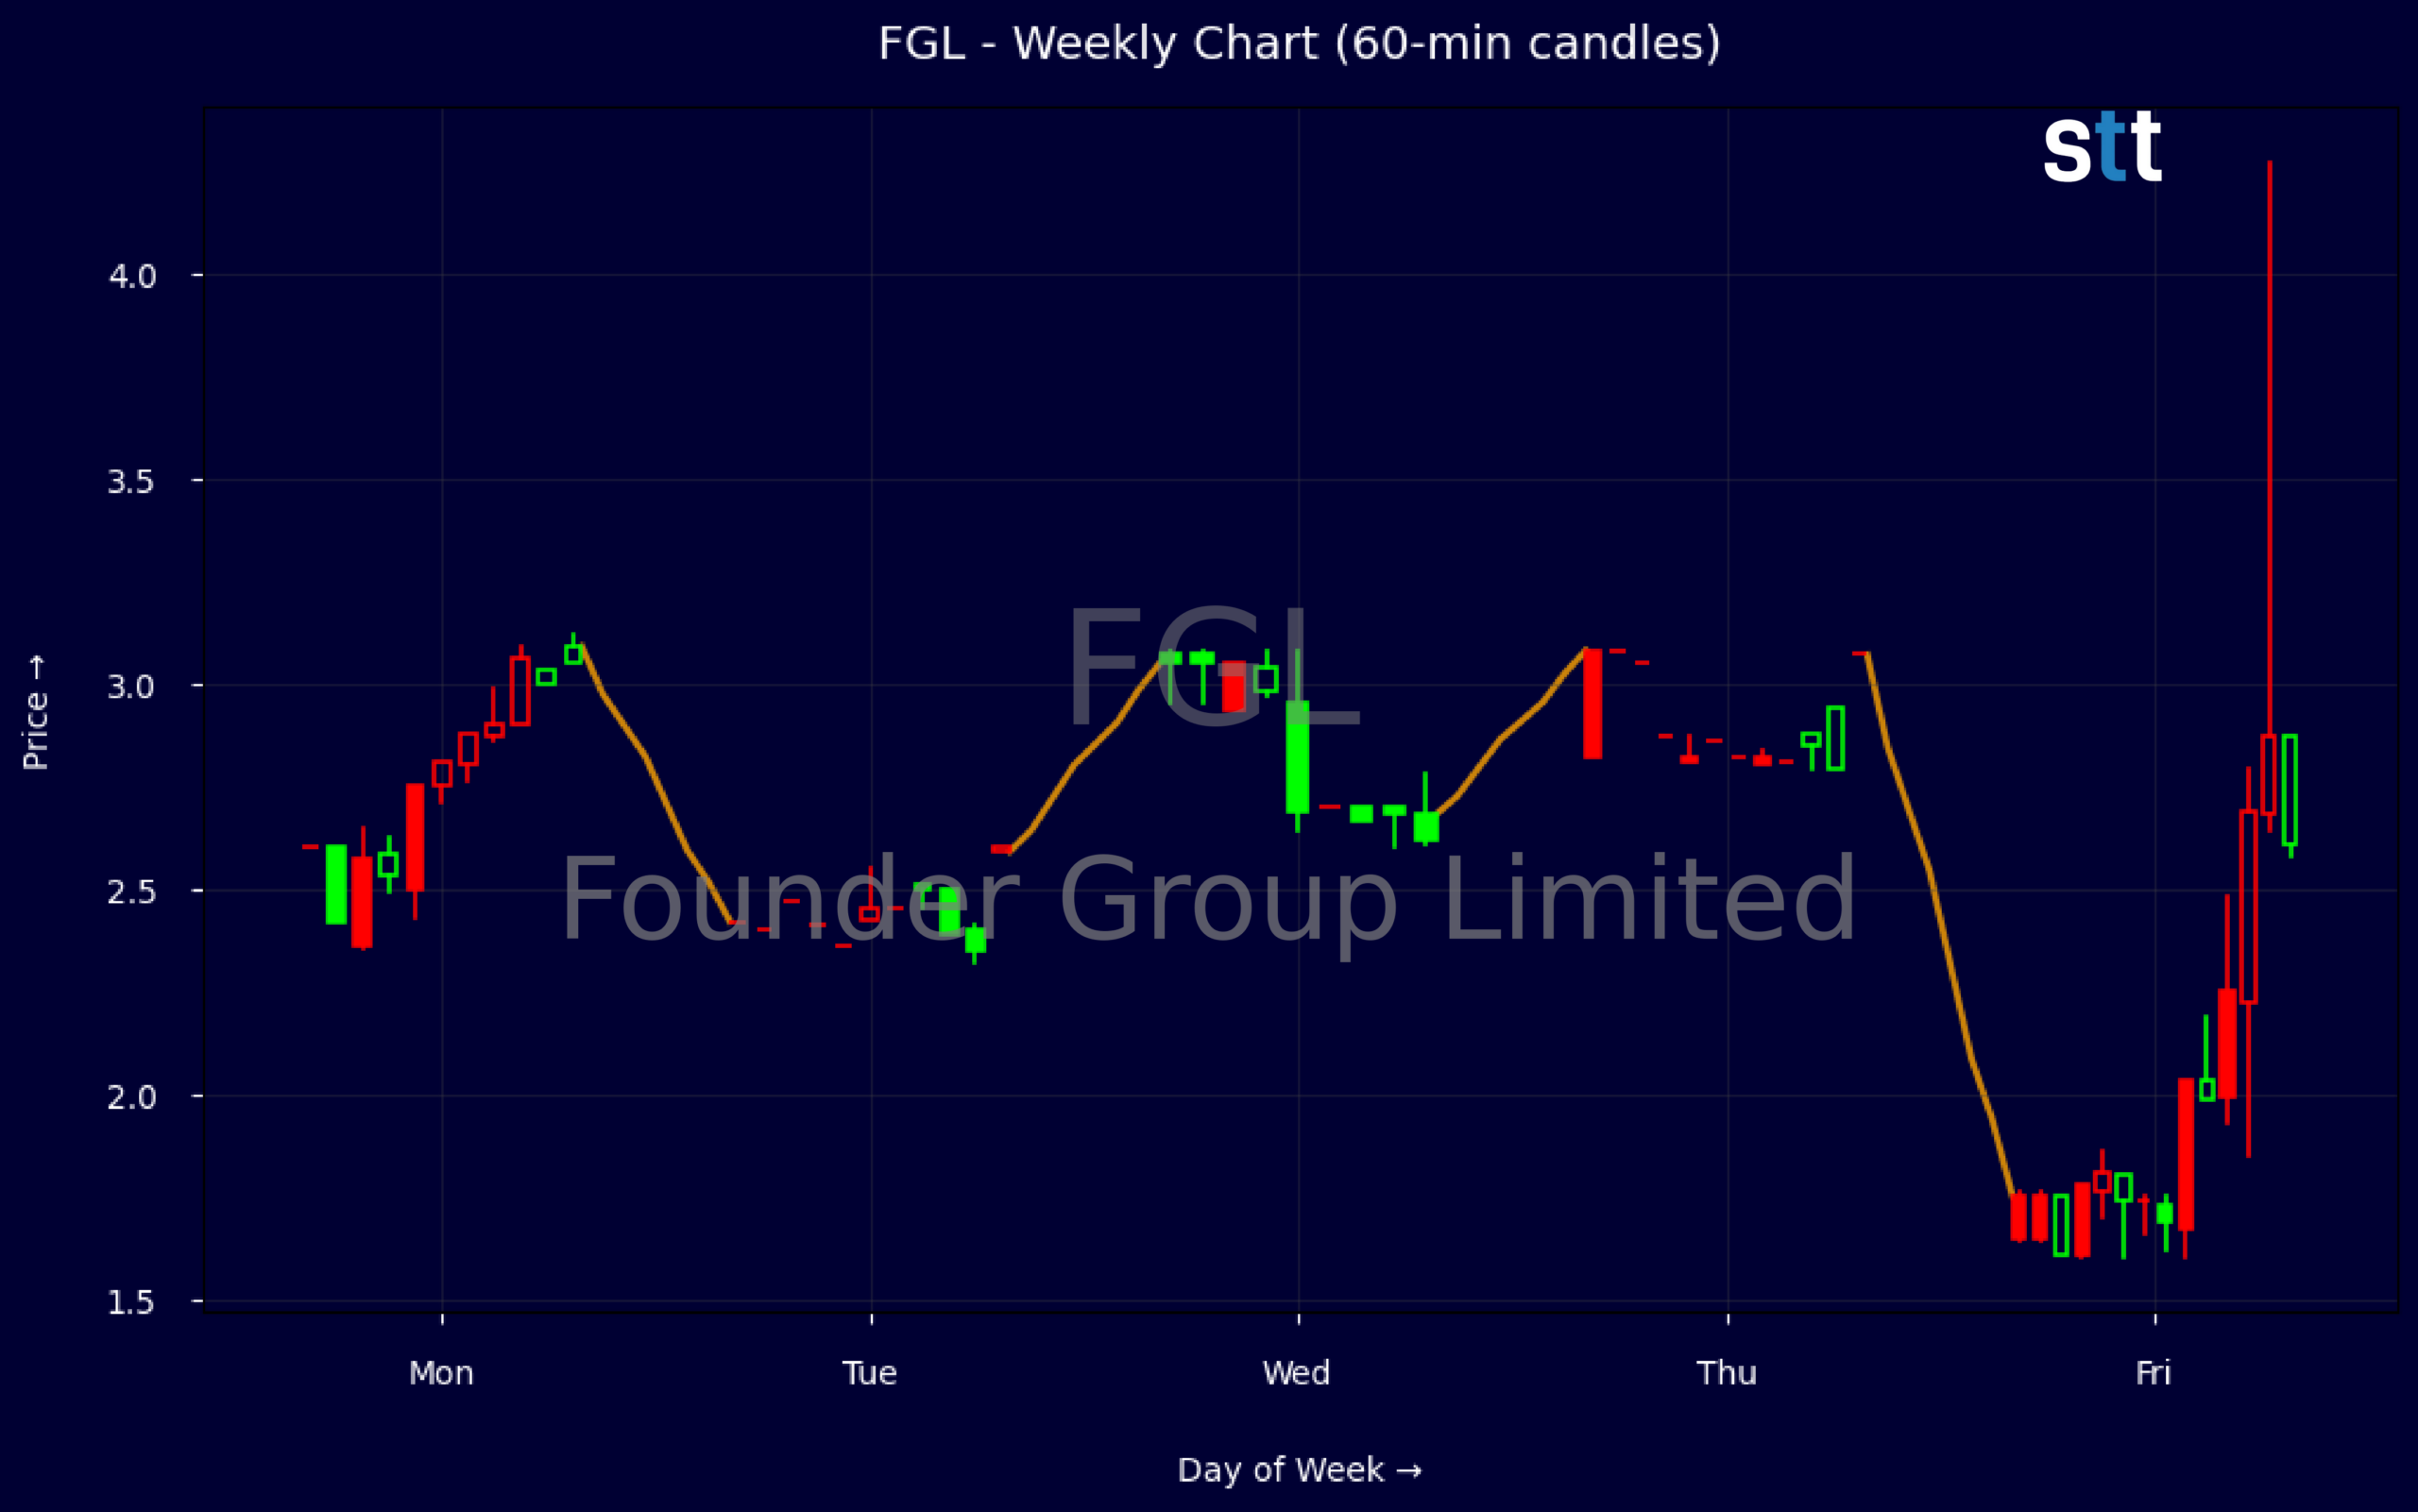
Weekly Update Oct 19 – Oct 23, 2026: On Sunday, October 25, 2026 Founder Group Limited stock [NASDAQ: FGL] is trending down by -42.51%! Discover the key drivers behind this movement as well as our expert analysis in the detailed breakdown below.
Energy industry expert:
Analyst sentiment – negative
FGL operates as a deeply discounted micro‑cap within the energy space, trading at only 0.13x sales and 0.92x book (BVPS ~20.6), implying the market assigns minimal value to its asset base despite substantial cash (≈€80m) and modest net PPE (~€22.7m). Leverage is high with a 6.3x ratio and long‑term debt of ~€17.5m against equity of ~€30.3m, while ROIC at -0.52% and zero ROA/ROE indicate capital inefficiency and likely loss‑making operations.
Technically, the weekly tape shows a failed breakout above 3.00: a spike from ~2.42 to a 3.08 high, followed by a retreat to 2.82 and then a sharp breakdown to 1.65, confirming a dominant bearish trend with heavy supply overhead near 2.80–3.10. Intraday 5‑minute candles (with expanded ranges and likely elevated volume on down moves) reinforce distribution. A clear actionable level is resistance at 2.00: short entries are attractive on rallies into 1.95–2.05 with tight stops above 2.20.
More Breaking News
- TTMI Stock Rebounds As Record Earnings Fuel Aggressive AI Push
- NOK Stock Pops On Q3 Beat And Aggressive Q4 Guidance
- CCI Soars As Crown Castle-SpaceX Talks Fuel Bullish Repricing
- CTVA Stock Plunges As Vylor Spin-Off Triggers Massive Repricing
With no material news flow, FGL trades as a balance‑sheet and sentiment story, lagging broader Energy and Renewable Energy Producers benchmarks that generally show positive ROE and trade closer to 1.3–2.0x book. Absent a visible growth pipeline or restructuring, the discount appears justified. Near term, downside support sits at 1.40–1.50; a decisive weekly close below 1.40 opens 1.00. Base‑case outlook is negative, with rallies toward 2.00 providing sell opportunities rather than accumulation.
Quick Financial Overview
Founder Group Limited (FGL) is trading like a classic high-volatility small cap: big ranges, quick reversals, and a valuation that looks cheap on paper. On the weekly chart, FGL pushed from the low 2s to above 3.00, tagging a high near 3.08 before rolling over. The subsequent slide to around 1.65 marks more than a 40% drawdown from the peak, which tells traders momentum buyers were trapped and supply overwhelmed demand at higher levels.
Intraday data reinforces that message. A single wide range bar from roughly 2.79 down to 1.60 in one session shows real selling pressure and likely stop runs. For short-term traders, that kind of range is opportunity and danger at the same time. It offers room for large percentage moves, but it also punishes anyone trading without a clear stop and size discipline.
Financially, FGL is not a story-stock with no numbers behind it. Revenue sits near $120.7M with an enterprise value around $13.2M, suggesting the market is pricing the company at roughly 0.13x sales and under 1x book value, with book value per share at 20.61. The balance sheet shows about $80.2M in cash versus total assets around $189.7M and total liabilities of $159.5M, resulting in equity just over $30.3M and working capital of about $21.9M. Leverage is notable with a 6.3 ratio and long-term debt near $17.5M, but liquidity looks decent for now, which matters when traders weigh tail risk against current price.
Conclusion
This is stock news, not investment advice. StocksToTrade News delivers real-time stock market updates tailored to highlight the key catalysts driving short-term price movements. Our coverage is designed for active traders and investors who thrive in fast-moving markets, with a focus on volatile sectors like penny stocks, AI stocks, Robinhood stocks and other momentum plays. From earnings reports and FDA approvals to mergers, new contracts, and unusual trading volume, we break down the events that can spark significant price action.
Looking to level up your trading game? Explore StocksToTrade, the ultimate platform for traders. With powerful tools designed for swing and day trading, integrated news scanning, and even social media monitoring, StocksToTrade keeps you one step ahead.
Check out our quick startup guide for new traders!
- How to Read Stock Charts: A Guide for Beginners
- Trading Plan: 6 Steps to Create One
- How To Create a Stock Watchlist
Ready to build your watchlists? Check out these curated lists:
Once your watchlist is set, take the next step and trade with confidence using StocksToTrade’s robust platform. Don’t miss out — grab your 14-day trial for just $7 and experience the edge you need to thrive in today’s fast-paced markets.