
Fermi Inc. stocks have been trading down by -6.04 percent after reports of a major product recall and regulatory probe.
Click Here for a Millionaire's POV on Trading FRMI
SUBSCRIBE FOR ALERTSJOIN 50,000+ ACTIVE TRADERS
Key Takeaways
- FRMI has dropped from about $5.14 to $3.16 over recent weeks, breaking key support and signaling a sharp momentum shift.
- Intraday trading in FRMI shows tight consolidation around $3.15–$3.20, suggesting short-term indecision after heavy selling.
- Fermi Inc. is burning cash, with roughly -$233.64M in free cash flow and negative earnings of -$0.04 per share last quarter.
- FRMI carries meaningful debt and a weak current ratio of 0.3, raising liquidity questions if conditions stay tight.
- Traders are watching whether FRMI can defend the $3 area or if another leg down opens up more downside.
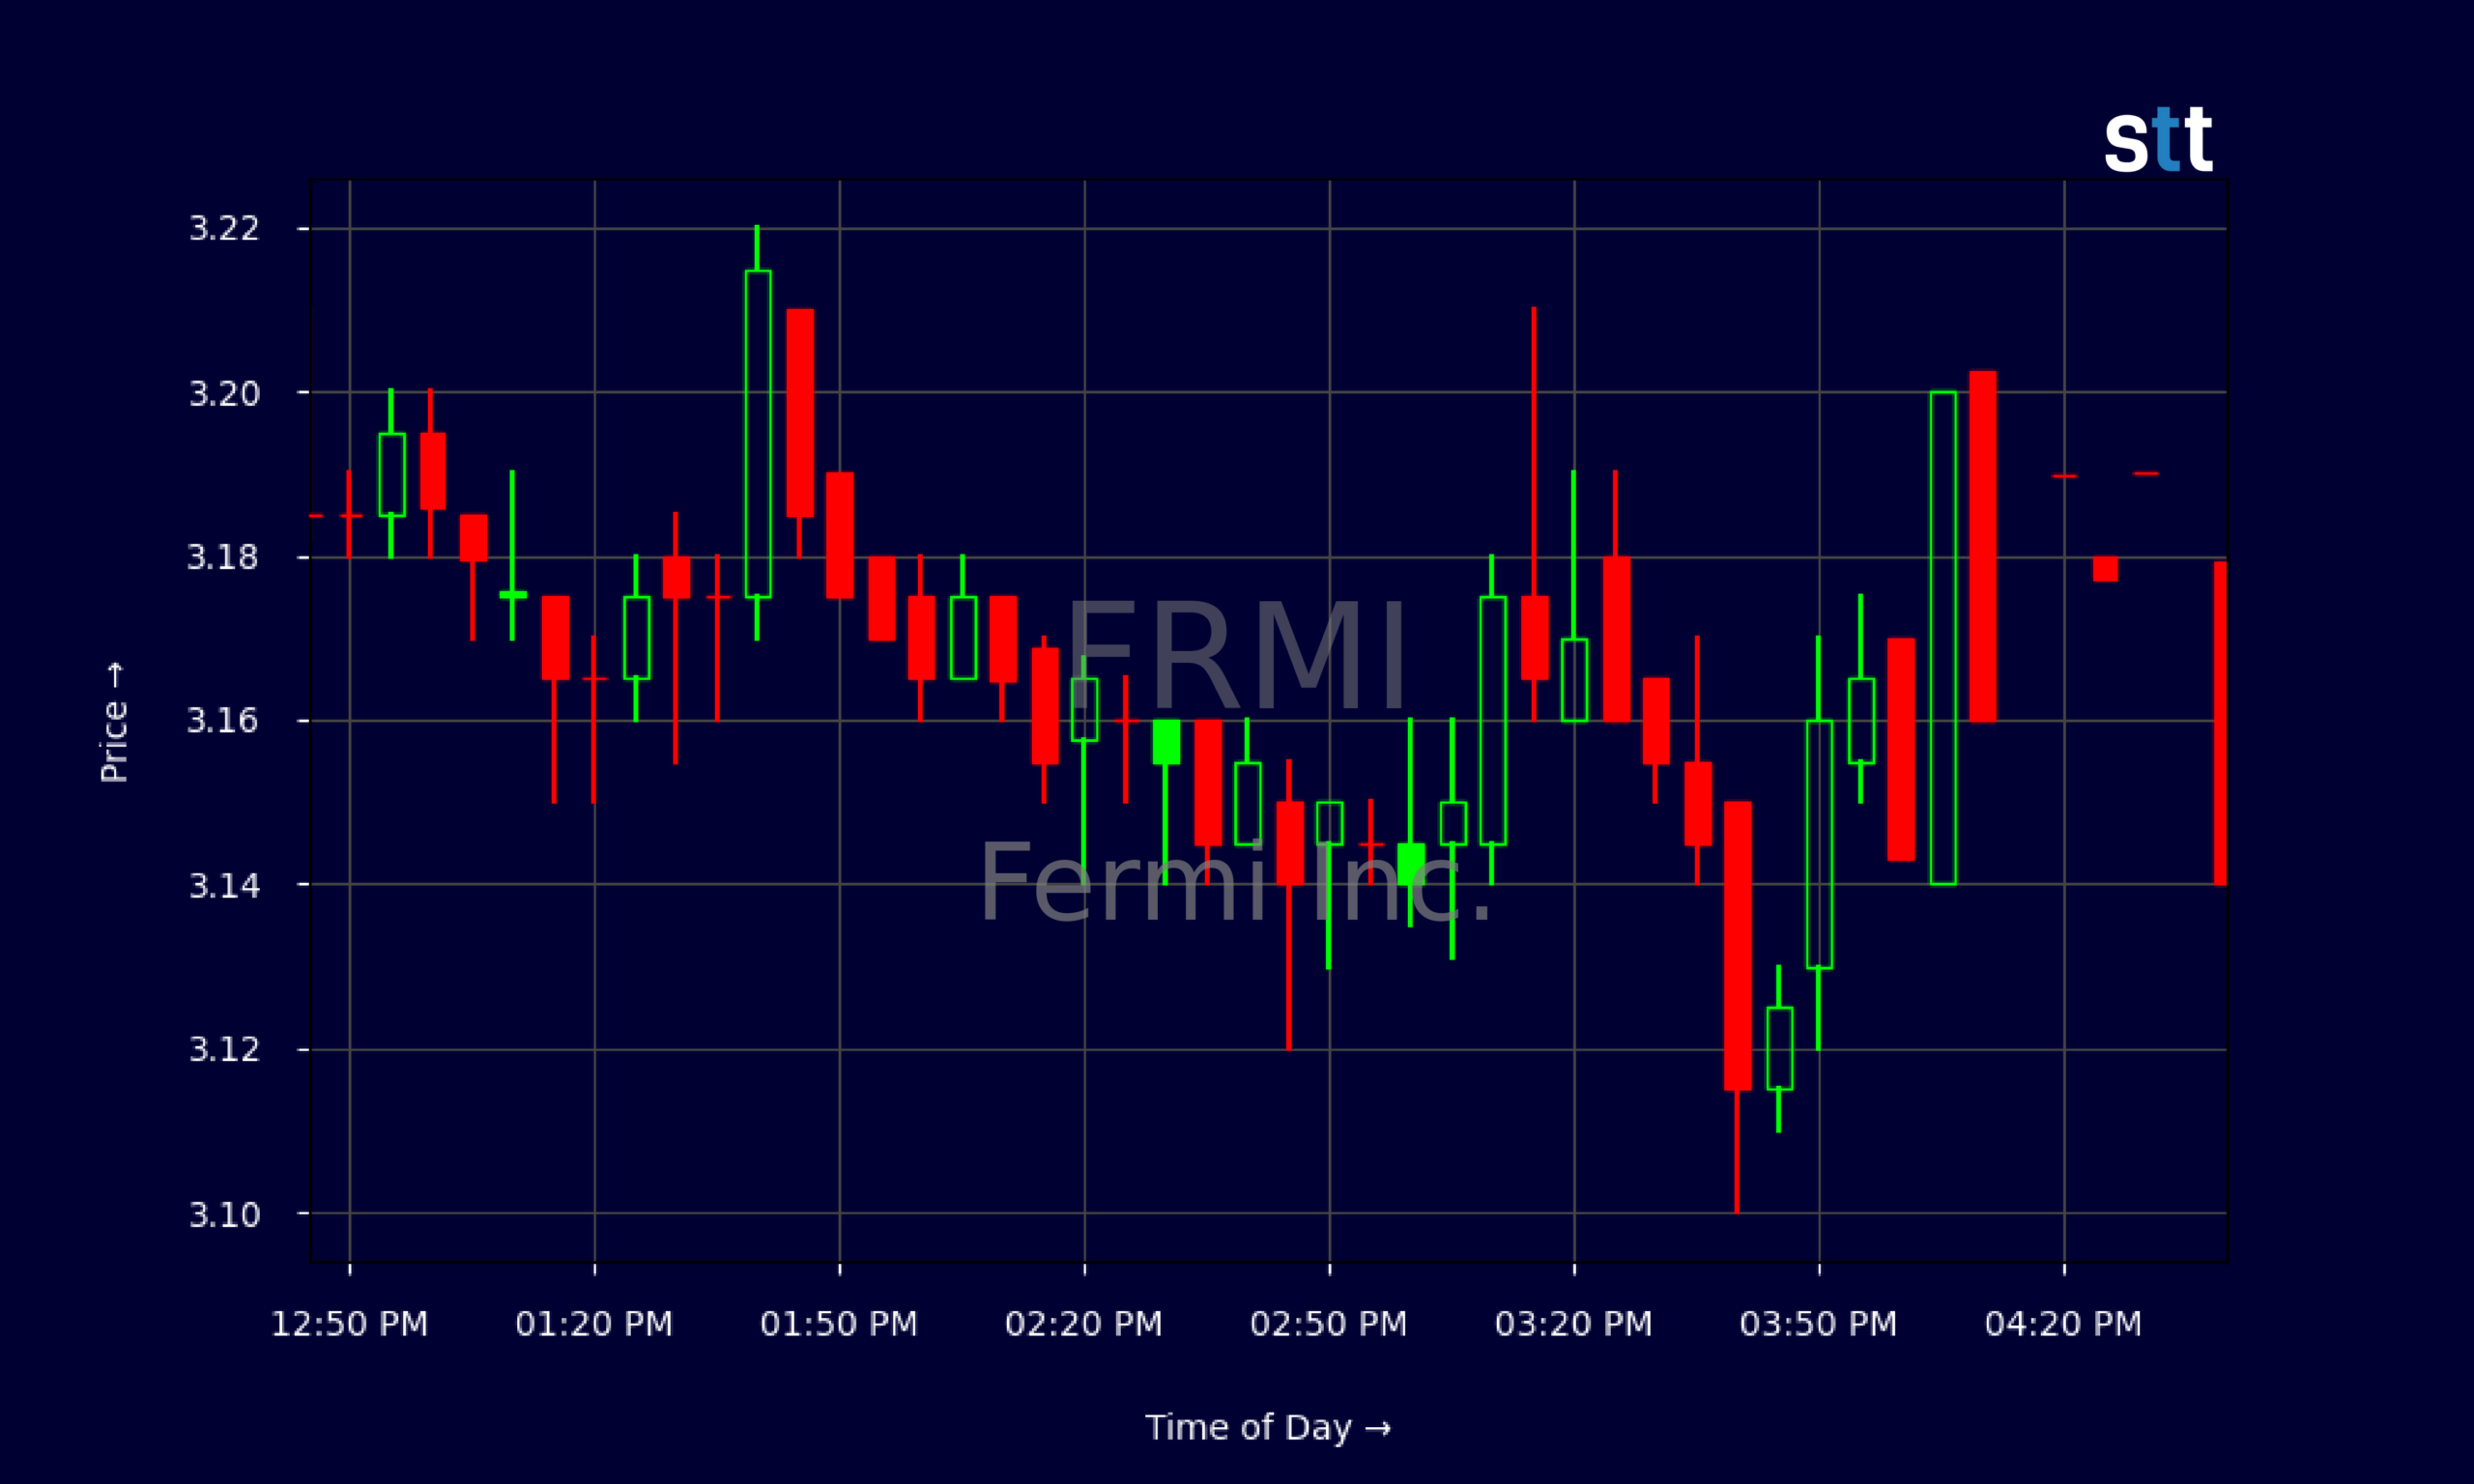
Live Update At 16:47:34 EDT: On Friday, October 16, 2026 Fermi Inc. stock [NASDAQ: FRMI] is trending down by -6.04%! Discover the key drivers behind this movement as well as our expert analysis in the detailed breakdown below.
Quick Financial Overview
FRMI is trading like a name under pressure. On the daily chart, Fermi Inc. has slid from a recent close near $5.14 down to about $3.16, a drawdown of roughly 38% in under a month. That’s a serious trend shift, and most traders in the FRMI community will treat it as a broken chart until proven otherwise.
Under the hood, the numbers back up the selling. Fermi Inc. posted a quarterly net loss of about $25.81M, or roughly -$0.04 per share, and EBITDA is also negative. Cash flow is worse: FRMI reported around -$48.67M in operating cash flow and -$233.64M in free cash flow, signaling aggressive spending that is not yet paying off.
More Breaking News
- DKS Stock Balances Insider Buying With Legal And Macro Risks
- SKHY Stock Slumps As CXMT DRAM Claims Rattle Chip Traders
- AAL Stock Slides As Fuel Shock Triggers Capacity Cuts And Target Downgrades
- EOG Resources Stock Draws Wave Of Bullish Price Target Hikes
The balance sheet shows total assets of about $1.76B against total liabilities of $731.48M. On paper, FRMI has equity of roughly $1.03B, but the current ratio is just 0.3, and the quick ratio is 0.1, which tells traders that near-term liquidity is tight. Long-term debt of about $520.09M and negative returns on assets and equity underline that Fermi Inc. is still in heavy build-out or turnaround mode, not a mature cash generator.
Why Traders Are Watching FRMI Price Support
FRMI is a classic momentum unwind on the chart. Just a few weeks ago, Fermi Inc. was closing above $5, with a local high near $5.23. From there, the daily candles show a steady bleed: lower highs from $4.82, to $4.55, to $4.21, then a clear breakdown into the mid-$3s. That stair-step pattern tells traders that each bounce in FRMI has been sold into.
The last few sessions matter. FRMI attempted to reclaim the $3.70–$4.00 zone, tagging highs around $4.06 and $4.12 earlier in the month, but sellers quickly knocked it back below $3.40 and now down into the $3.10–$3.20 area. For Fermi Inc., that shift from grinding up to failing at prior support is typically where short-biased traders start leaning harder.
Intraday, the 5‑minute chart shows FRMI spending most of the day chopping in a narrow band between roughly $3.14 and $3.22. Early in the session, there was some energy, with Fermi Inc. popping toward $3.38, but that strength faded and the stock trended down into the close. Volume-driven spikes are getting smaller, which often signals exhaustion on both sides and the potential for a bigger move when new volume arrives.
Against this price action, FRMI’s valuation metrics send mixed signals. A price-to-book ratio around 2.13 tells traders the market is still giving Fermi Inc. some credit for future growth, despite negative returns and cash burn. That blend—weak short-term trend, stressed liquidity, but non-distressed valuation—is exactly why momentum traders are stalking FRMI for either a panic flush or a sharp oversold bounce.
Conclusion
For active traders, FRMI is a real-time lesson in how story and numbers can diverge from price. On one hand, Fermi Inc. controls significant assets, with net property, plant, and equipment near $1.60B and common equity above $1.03B. On the other, FRMI is burning cash fast, with negative free cash flow and a current ratio so low that near-term obligations demand constant attention.
That tension often produces big moves. If FRMI loses the $3 area with size behind it, chart-based traders will likely target the next psychological levels below, looking for panic to create short-term reward. If, instead, Fermi Inc. can hold this zone and push back through $3.40–$3.60 on volume, you’ll see dip-buyers trying to ride an oversold squeeze.
Either way, the plan matters more than the opinion. As Tim Sykes loves to say, “Discipline and cutting losses quickly is the best risk management — be a sniper.” In the same vein, As Tim Bohen, lead trainer with StocksToTrade says, “I never chase price. The best opportunities allow me to enter on my terms, not when I’m feeling pressured.” For FRMI, that means defining your key levels, respecting your stops, and treating Fermi Inc. as a trading vehicle, not a long-term promise. This breakdown is for educational and research purposes only, and every trader needs to do their own homework before taking risk.
This is stock news, not investment advice. StocksToTrade News delivers real-time stock market updates tailored to highlight the key catalysts driving short-term price movements. Our coverage is designed for active traders and investors who thrive in fast-moving markets, with a focus on volatile sectors like penny stocks, AI stocks, Robinhood stocks and other momentum plays. From earnings reports and FDA approvals to mergers, new contracts, and unusual trading volume, we break down the events that can spark significant price action.
Looking to level up your trading game? Explore StocksToTrade, the ultimate platform for traders. With powerful tools designed for swing and day trading, integrated news scanning, and even social media monitoring, StocksToTrade keeps you one step ahead.
Check out our quick startup guide for new traders!
- How to Read Stock Charts: A Guide for Beginners
- Trading Plan: 6 Steps to Create One
- How To Create a Stock Watchlist
Ready to build your watchlists? Check out these curated lists:
Once your watchlist is set, take the next step and trade with confidence using StocksToTrade’s robust platform. Don’t miss out — grab your 14-day trial for just $7 and experience the edge you need to thrive in today’s fast-paced markets.