

FedEx Freight Holding Company Inc. stocks have been trading up by 15.78 percent after announcing major network expansion and efficiency upgrades
Key Takeaways
- Shares of FDXF pushed from $115 to $127 in one session, signaling strong momentum and aggressive dip-buying.
- Recent FDXF daily candles show a steady grind higher from the low $110s with higher lows holding.
- FedEx Freight Holding Company Inc. posted about $8.80B in revenue and maintains solid working capital, but free cash flow is negative.
- Heavy debt on the FedEx Freight Holding Company Inc. balance sheet keeps leverage high even as returns on assets stay positive.
- Active traders are watching FDXF intraday support around $124–$125 and resistance near $128 for possible range breaks.
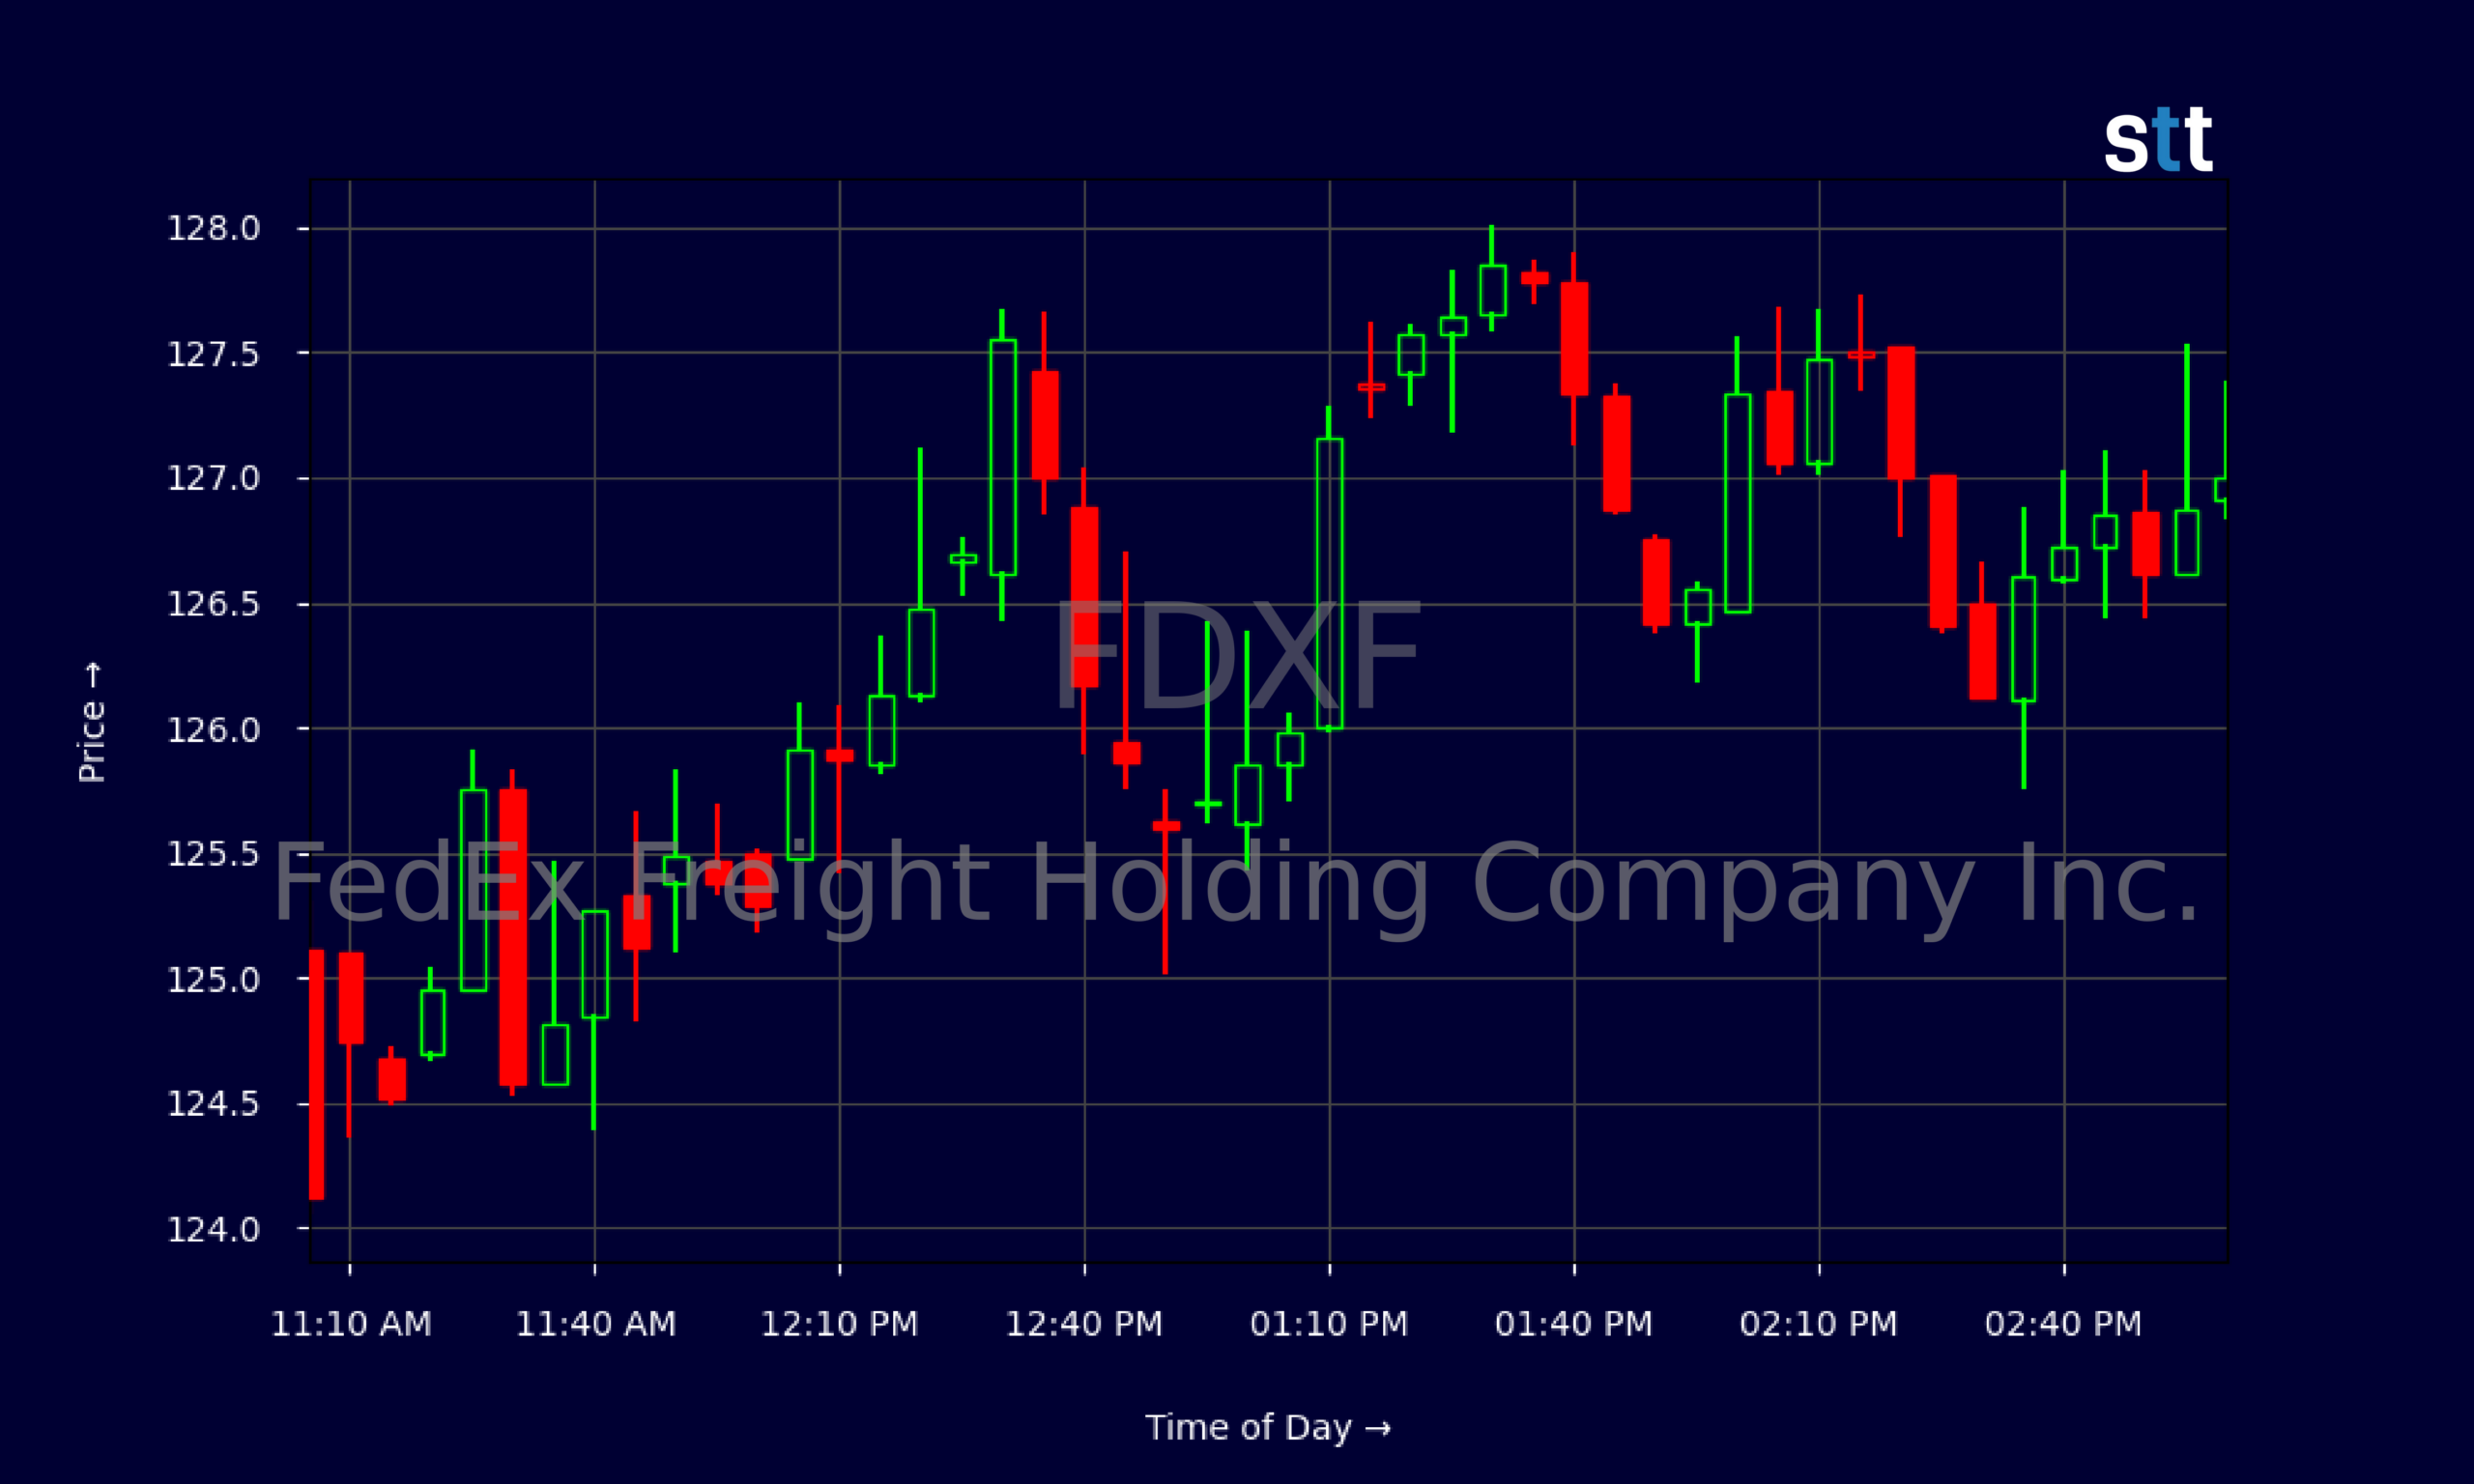
Live Update At 15:03:10 EDT: On Friday, October 30, 2026 FedEx Freight Holding Company Inc. stock [NYSE: FDXF] is trending up by 15.78%! Discover the key drivers behind this movement as well as our expert analysis in the detailed breakdown below.
Quick Financial Overview
FDXF is trading like a classic momentum freight name, with price action running ahead of the fundamentals. Over the past few weeks, FedEx Freight Holding Company Inc. has held a rising range between roughly $108 and $115 before breaking out toward $127. That tells traders FDXF is drawing consistent demand on dips, with weak hands getting shaken out below $110 and then squeezed as the stock spikes back.
On the fundamental side, FedEx Freight Holding Company Inc. generated about $8.80B in revenue, translating to roughly $58.82 per share. A pretax profit margin near 9.9% shows FDXF is still profitable at the operating level, and return on assets of 4.39% confirms the business is at least squeezing some respectable earnings out of its truck and terminal base.
More Breaking News
- CareDx CDNA Rips Higher After Big Earnings Beat And Guidance Hike
- NCPL Plunges As SEC Fraud Charges Ignite Class Actions
- MPT Stock Slides As Traders Focus On Debt And Cash Flow
- GoDaddy GDDY Jumps As Earnings Beat And AI Airo Shine
But the balance sheet is not light. Long‑term debt stands around $4.48B, with total long‑term debt and capital lease obligations near $6.15B. FedEx Freight Holding Company Inc. reported negative free cash flow of about -$346M for the latest quarter, driven by working capital pressure. Traders studying FDXF must balance respectable profitability against a levered capital structure and cash burn.
Why Traders Are Watching FDXF Price Action
The key reason FDXF is on watch lists right now is the chart. FedEx Freight Holding Company Inc. just posted a powerful breakout day, jumping from an open near $115.20 to a close around $127. That is a double‑digit percentage move in one session, backed by strong, steady intraday climbing from the opening flush to midday consolidation and then a late‑day push.
Intraday, FDXF opened with volatility, ripping from the $115s into the mid‑$120s within the first hour. From there, FedEx Freight Holding Company Inc. built a tight range between $124 and $127 for most of the session. Each pullback toward $124–$125 attracted buyers, and every selloff was shallow. That is classic trend‑day behavior and exactly the kind of pattern momentum traders scan for.
Zooming out, the daily chart for FDXF shows a series of higher lows from roughly $105 up to the $110–$113 area, with repeated closes above prior resistance. FedEx Freight Holding Company Inc. tested the $113–$115 zone multiple times earlier in the month and finally broke through with conviction. When a freight stock like FDXF breaks a multi‑day ceiling and holds above it, short sellers are often forced to cover, powering the move.
At the same time, traders know the fundamentals are mixed. FedEx Freight Holding Company Inc. is profitable, but the negative book value per share (around -$3.32) and heavy leverage stand out. That kind of structure can amplify moves both ways. Strong days in FDXF can run far, but failed breakouts can unwind quickly when traders rush for the exits.
Conclusion
For active traders, FDXF is a pure price‑action classroom right now. FedEx Freight Holding Company Inc. is showing what a trend day looks like, with a big gap, steady higher lows intraday, and a close near the top of the range. The recent push from the low $110s into the high $120s turns that prior resistance band into a key support zone that traders will track on every pullback.
On the fundamentals, FDXF sits in a gray zone: solid revenue, decent margins, and positive return on assets, but negative free cash flow and a heavy debt load. That mix creates tension. If freight demand stays firm and pricing holds, FedEx Freight Holding Company Inc. can justify the current momentum. If the cycle turns or costs bite, the leverage could start to matter fast.
For short‑term trading, the important levels are clear. Intraday support in the mid‑$120s and resistance around $128–$130 set the immediate battlefield. Swing traders will be watching whether FDXF can keep closing above prior highs near $113–$115 on any pullback. As Tim Sykes loves to remind his students, “The chart is your roadmap, but risk management is your seatbelt.” In the same spirit of disciplined trade planning, As Tim Bohen, lead trainer with StocksToTrade says, “If you’re still guessing at the end of your analysis, it’s probably not a trade worth taking.” With FDXF, that means respecting the trend, but cutting losses fast the moment the price action cracks. This analysis is for educational and research purposes only, not trading advice.
This is stock news, not investment advice. StocksToTrade News delivers real-time stock market updates tailored to highlight the key catalysts driving short-term price movements. Our coverage is designed for active traders and investors who thrive in fast-moving markets, with a focus on volatile sectors like penny stocks, AI stocks, Robinhood stocks and other momentum plays. From earnings reports and FDA approvals to mergers, new contracts, and unusual trading volume, we break down the events that can spark significant price action.
Looking to level up your trading game? Explore StocksToTrade, the ultimate platform for traders. With powerful tools designed for swing and day trading, integrated news scanning, and even social media monitoring, StocksToTrade keeps you one step ahead.
Check out our quick startup guide for new traders!
- How to Read Stock Charts: A Guide for Beginners
- Trading Plan: 6 Steps to Create One
- How To Create a Stock Watchlist
Ready to build your watchlists? Check out these curated lists:
Once your watchlist is set, take the next step and trade with confidence using StocksToTrade’s robust platform. Don’t miss out — grab your 14-day trial for just $7 and experience the edge you need to thrive in today’s fast-paced markets.