
Exascale Labs Holdings Inc. surged as stocks have been trading up by 20.48 percent following breakthrough exascale computing advancements.
Click Here for a Millionaire's POV on Trading XLAB
SUBSCRIBE FOR ALERTSJOIN 50,000+ ACTIVE TRADERS
Key Takeaways
- Shares of Exascale Labs Holdings Inc. have slid from the $2.80s to near $1.30, showing a clear downtrend with sharp bounces that active traders target.
- Intraday XLAB action between $1.40 and $1.80 shows wide swings, signaling heavy speculative trading and weak hands getting shaken out.
- XLAB posts roughly $7.0M in revenue but runs deep negative equity and steep losses, flashing a classic high-risk, story-stock profile.
- Recent cash raises pushed cash above $4.2M and lifted working capital, giving XLAB some runway despite heavy liabilities.
- Traders are watching $1.20–$1.00 support and $1.80–$2.00 resistance as key levels for the next momentum move in XLAB.
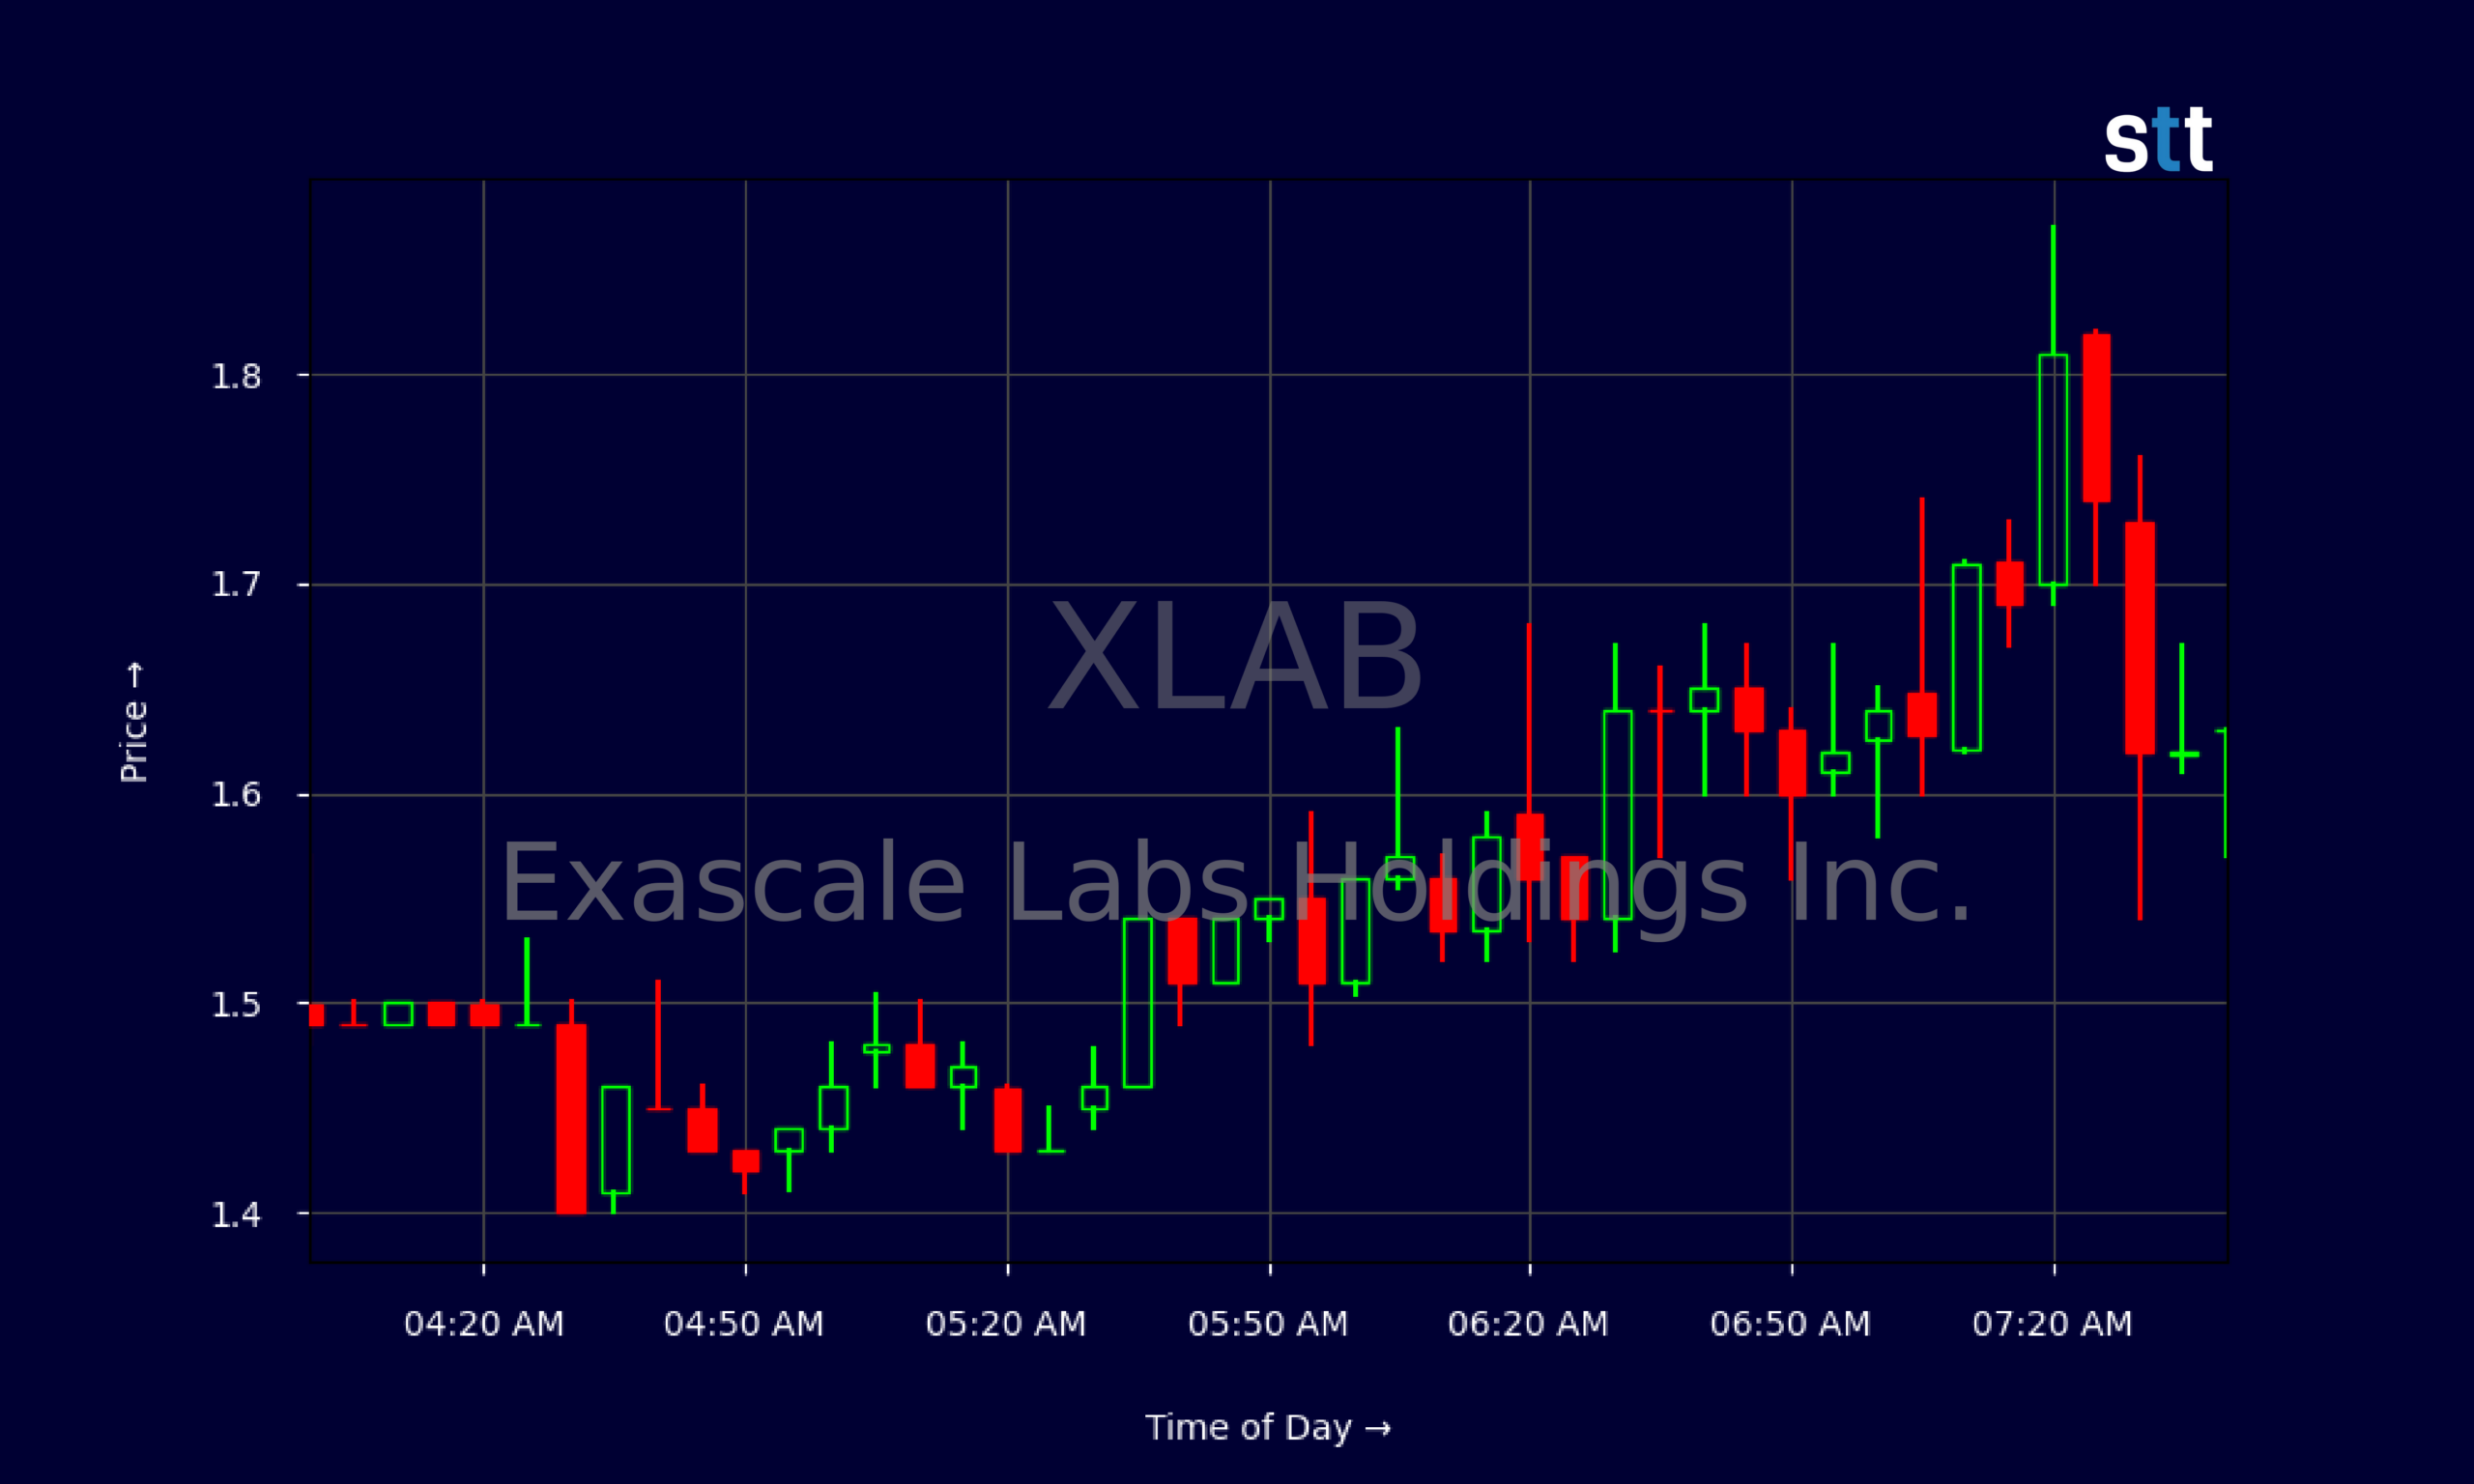
Live Update At 07:46:56 EDT: On Friday, October 16, 2026 Exascale Labs Holdings Inc. stock [NASDAQ: XLAB] is trending up by 20.48%! Discover the key drivers behind this movement as well as our expert analysis in the detailed breakdown below.
Quick Financial Overview
Exascale Labs Holdings Inc., trading as XLAB, is a small, high-volatility name that fits right into the niche many day traders hunt. On the surface, XLAB delivers about $7.0M in revenue, a solid top line for a tiny tech-style name. But dig deeper and the story gets a lot more speculative.
The company’s pretax profit margin sits near -70%. That means for every $1 in sales, XLAB is losing roughly $0.70 before taxes. Return on assets around -36% confirms that the business is not yet converting its asset base into profits. XLAB’s price-to-sales ratio near 16.7 says traders are paying more than $16 for each $1 in revenue — a rich multiple that only makes sense if growth and future execution improve.
More Breaking News
- IBRX Stock Under Pressure As Legal Probes Mount
- Ondas Inc. Stock Pulls Back As Massive Defense Backlog Builds
- NOK Stock Slides As European ADR Weakness Deepens
- FRMI Stock Slides As Traders Focus On Cash Burn And Support
On the balance sheet, Exascale Labs Holdings Inc. holds about $4.2M in cash against more than $20.3M in liabilities and negative equity of roughly -$13.0M. That negative book value and working capital near -$13.0M scream “speculative.” At the same time, operating cash flow turned positive, and a recent stock issuance brought in about $4.3M, which temporarily stabilizes XLAB’s cash position and keeps the story in play for traders.
Why Traders Are Watching XLAB Price Action
What pulls traders to XLAB right now is not a smooth uptrend. It’s the chaos.
On the daily chart, Exascale Labs Holdings Inc. has unraveled from the $2.80–$3.00 zone down into the $1s over a few weeks. That’s a drawdown of more than 50%, which often leaves a trail of bag-holders and short sellers. XLAB topped near $2.94–$3.06, then rolled, breaking through $2.50, $2.00, and finally the mid-$1s. Each break tested former support and turned it into resistance — classic momentum breakdown behavior.
But the story doesn’t end with the fade. In the last few sessions, XLAB printed a wild spike: one day it dipped to about $0.78 and then ripped to $1.45, closing near $1.36. That type of intraday range — almost a 2x swing off the lows — is the kind of panic-and-snap pattern experienced traders stalk. It shows that XLAB still commands attention and volume, even as the longer trend points down.
The intraday five‑minute chart confirms the battle. XLAB trades heavy between roughly $1.40 and $1.80, with repeated pushes toward $1.80 that fail and washouts to the $1.50s that bounce. That back‑and‑forth is where short-term traders can scalp, provided they respect their stops. A clean reclaim and hold of $1.80–$2.00 turns the pressure back on shorts. A break under $1.30–$1.20, by contrast, opens the door to a retest of $1.00 and possibly those sub‑$1 wicks that XLAB already showed.
For now, XLAB is a watchlist name for volatility, not safety.
Conclusion
Exascale Labs Holdings Inc. sits in a familiar spot for small, speculative tech-style names. The fundamentals for XLAB show real revenue growth, but heavy losses, negative equity, and a leveraged balance sheet. Traders paying more than 16x sales are not buying today’s numbers; they are trading tomorrow’s story and the volatility along the way.
On the chart, XLAB is a textbook lesson in both momentum and risk. A fast collapse from nearly $3.00 into the low $1s shook out late buyers, while the violent intraday spike from around $0.78 to $1.45 reminded everyone how quickly a crowded short or oversold level can unwind. For pattern-focused traders, Exascale Labs Holdings Inc. is now defined by clear levels: $1.00–$1.20 as a must-hold support zone and $1.80–$2.00 as the key range where a squeeze can ignite.
This is where discipline matters. As Tim Sykes likes to say, “The best traders aren’t the ones who find the hottest stock, they’re the ones who manage their risk so they can trade again tomorrow.” As Tim Bohen, lead trainer with StocksToTrade says, “A good trade setup checks all the boxes—volume, trend, catalyst. Don’t trade if you’re missing pieces of the puzzle.”. XLAB gives plenty of action, but it demands strict risk control, small position sizing, and a written plan. For educational and research-focused traders who study charts, track volume, and cut losses fast, Exascale Labs Holdings Inc. is a live case study in how momentum names rise, crack, and then either fade away or set up for the next big squeeze.
This is stock news, not investment advice. StocksToTrade News delivers real-time stock market updates tailored to highlight the key catalysts driving short-term price movements. Our coverage is designed for active traders and investors who thrive in fast-moving markets, with a focus on volatile sectors like penny stocks, AI stocks, Robinhood stocks and other momentum plays. From earnings reports and FDA approvals to mergers, new contracts, and unusual trading volume, we break down the events that can spark significant price action.
Looking to level up your trading game? Explore StocksToTrade, the ultimate platform for traders. With powerful tools designed for swing and day trading, integrated news scanning, and even social media monitoring, StocksToTrade keeps you one step ahead.
Check out our quick startup guide for new traders!
- How to Read Stock Charts: A Guide for Beginners
- Trading Plan: 6 Steps to Create One
- How To Create a Stock Watchlist
Ready to build your watchlists? Check out these curated lists:
Once your watchlist is set, take the next step and trade with confidence using StocksToTrade’s robust platform. Don’t miss out — grab your 14-day trial for just $7 and experience the edge you need to thrive in today’s fast-paced markets.