

Cohu Inc. stocks have been trading up by 14.05 percent following optimistic analyst upgrades and stronger-than-expected semiconductor equipment demand.
What Traders Need To Know
- Management plans to present at two semiconductor-focused conferences hosted by Needham and Jefferies, which may offer fresh commentary on Cohu Inc.’s outlook.
- Recent Form 4 filings on 2026/08/06, 2026/08/18, and 2026/08/21 show insider ownership changes, but give no detail on size, price, or whether they were buys or sells.
- Weekly price data show COHU pulling back from the mid‑$40s before a sharp push above $52, hinting at renewed momentum.
- Intraday action shows a strong 5‑minute surge from the low‑$47 area to above $50, signaling aggressive short-term buying interest.
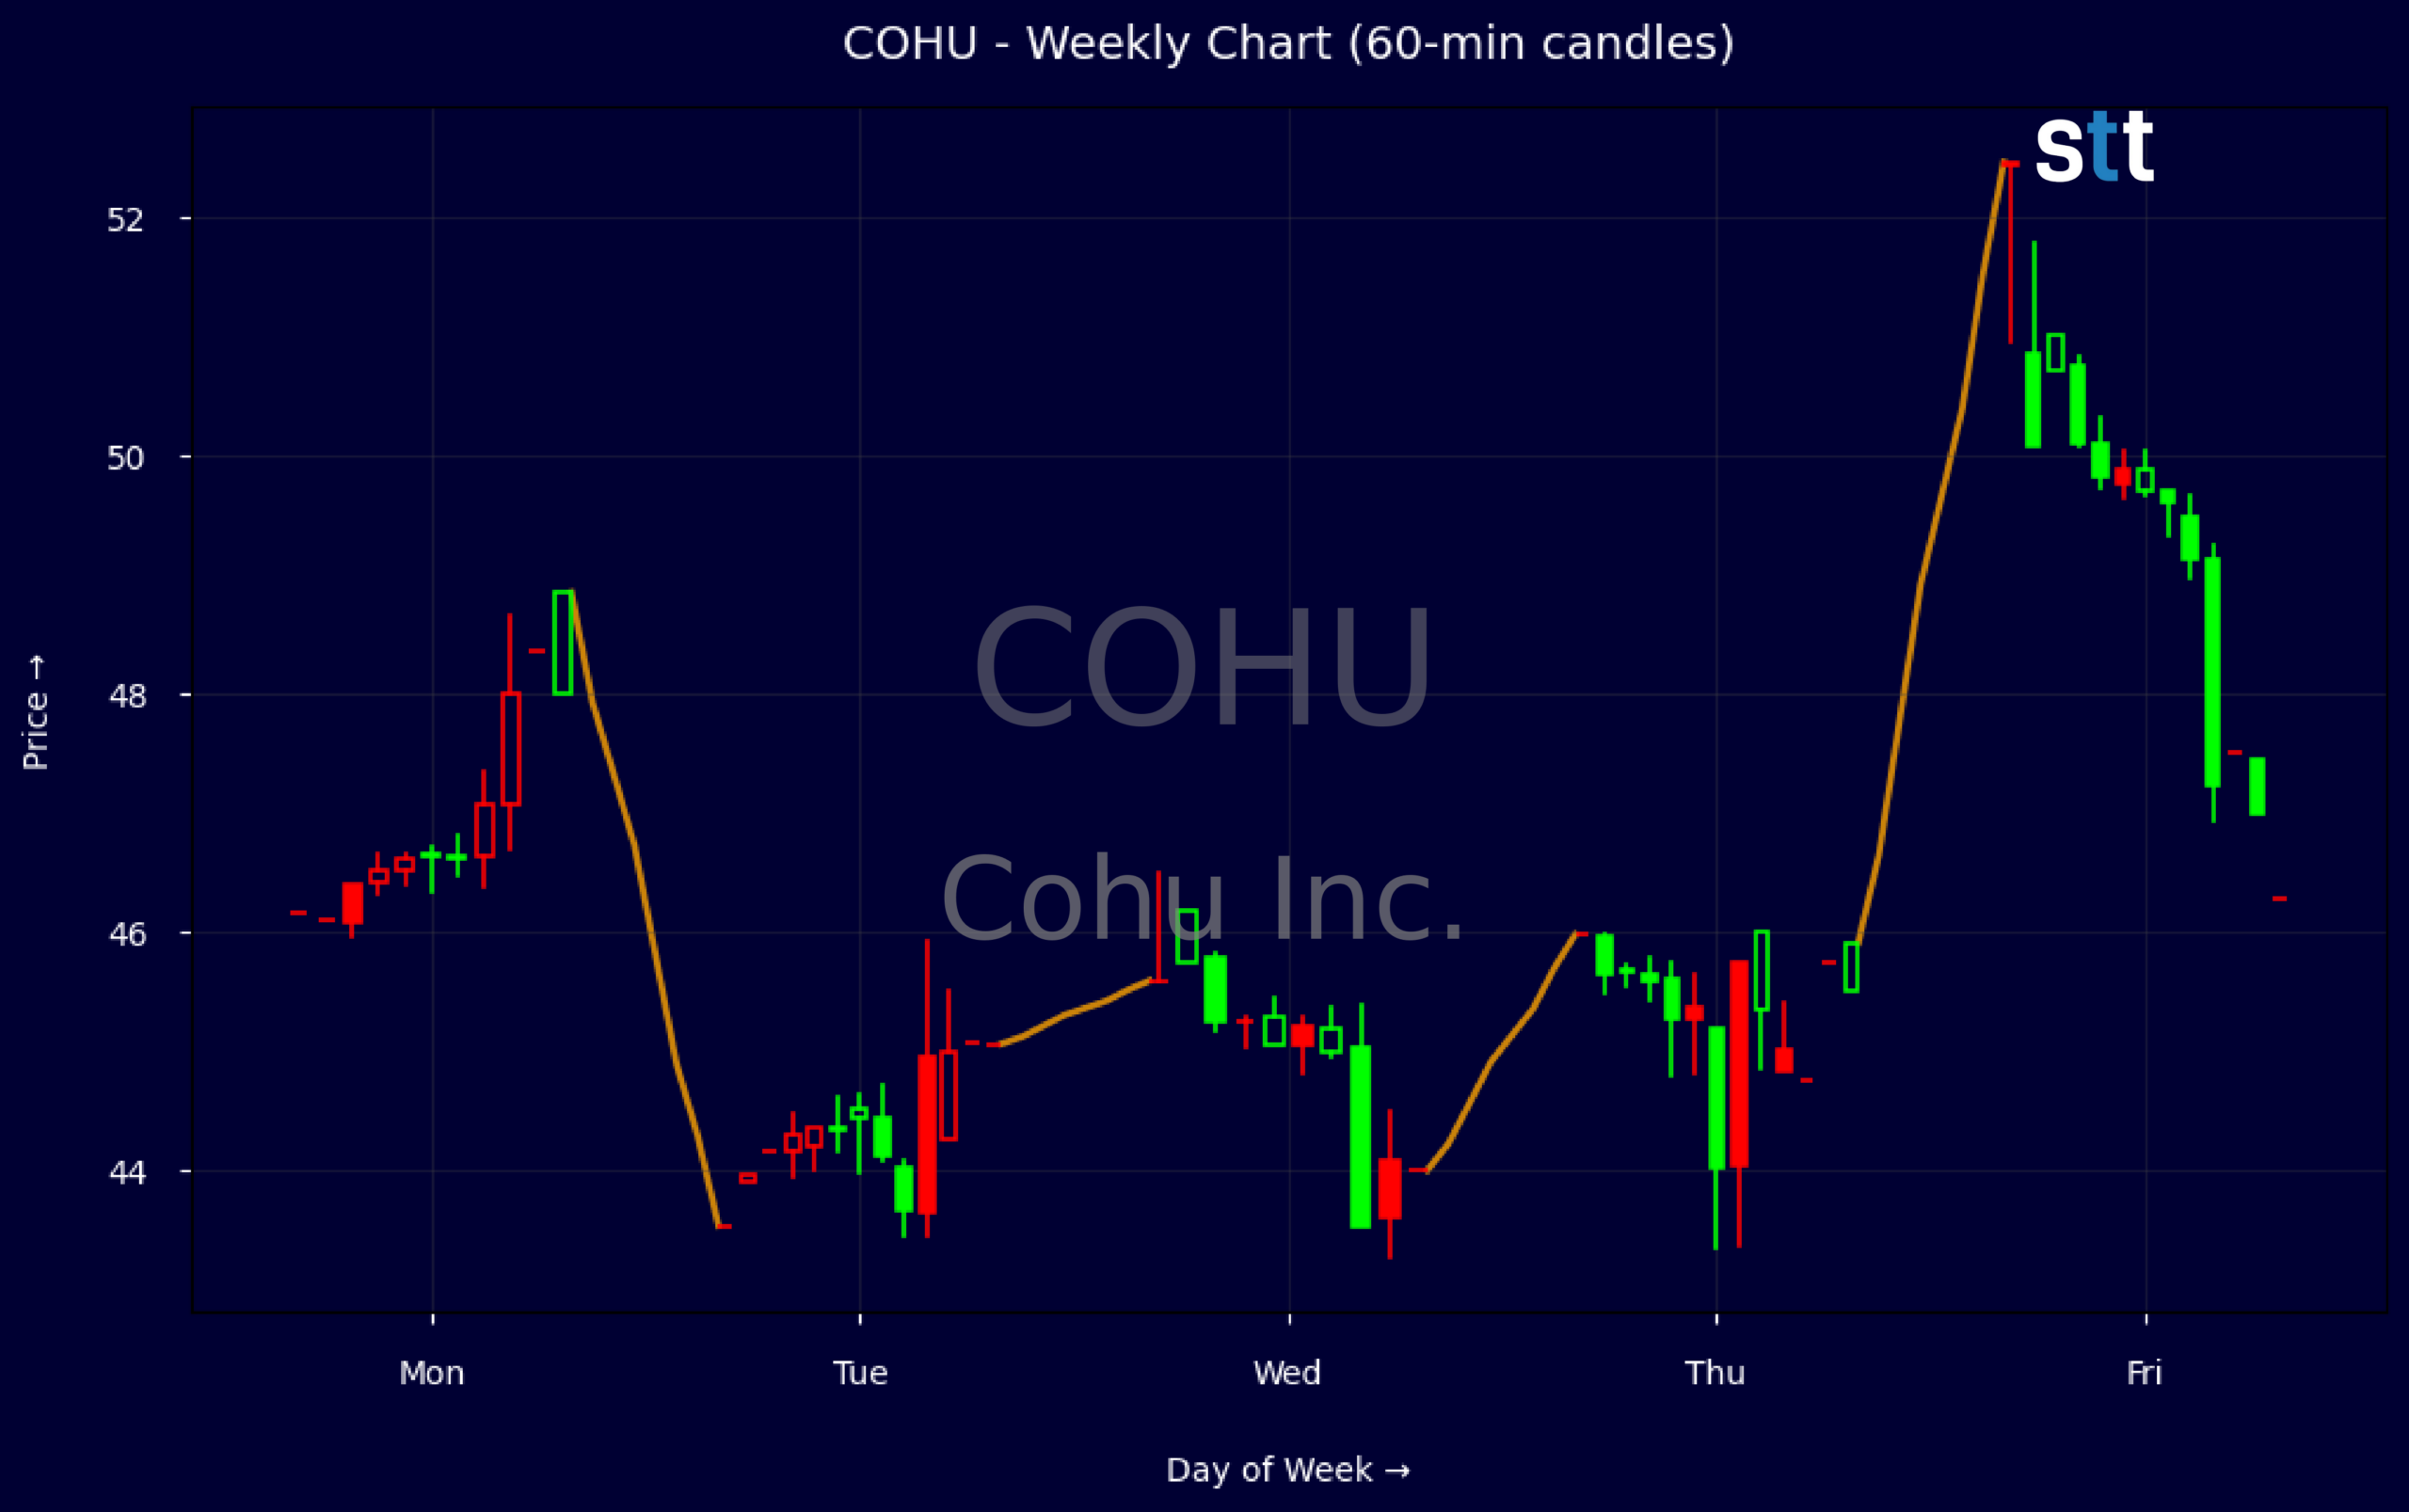
Weekly Update Aug 31 – Sep 04, 2026: On Saturday, September 05, 2026 Cohu Inc. stock [NASDAQ: COHU] is trending up by 14.05%! Discover the key drivers behind this movement as well as our expert analysis in the detailed breakdown below.
Technology industry expert:
Analyst sentiment – neutral
Cohu occupies a niche position in test and handling within semiconductor capital equipment, with solid gross margin (75%) but currently subscale earnings power: EBIT margin is mildly negative on a TTM basis and ROIC is firmly negative. Revenue has contracted mid‑single digits annually over 3–5 years, yet the balance sheet is strong with net cash, current ratio 5.7, and low leverage (total debt/equity 0.38). Cash generation is improving (Q2 FCF ~$8.1M), but valuation at ~4.2x sales and ~2.8x book already embeds a cyclical recovery.
Technically, Cohu’s tape shows a strong short‑term up‑move: after dipping to 43.53 it rebounded sharply, closing the week at 52.44, well above recent opens near 46, signaling aggressive buying and a bullish momentum break. Intraday 5‑minute candles indicate expanding ranges and elevated volume on up‑moves, confirming institutional participation. The dominant trend is now up, with initial support at 46–47 (recent breakout area). Tactically, a buy‑on‑pullback near 47 with a stop below 43.50 offers an attractive risk/reward.
More Breaking News
- CMCSA Stock Grinds Higher As Earnings Beat Meets Big Restructure
- SPCX Slides As Policy Shocks And New Rivals Hit SpaceX
- FDXF Stock Climbs As Price Action Attracts Momentum Traders
- BTG Stock Pulls Back As Charts Flash Key Support
Near‑term catalysts center on management’s semiconductor investor‑conference appearances, which should reinforce the recovery narrative and highlight test capacity leverage into AI, automotive, and industrial demand. The unspecified insider Form 4s are noise without clear selling pressure. Versus broader tech and semi‑equipment indices, Cohu offers higher cyclical torque but weaker profitability. Upside is capped near prior congestion in the mid‑$50s; I see 12‑month fair value at $58 with key support at $46 and resistance at $55–60.
Quick Financial Overview
Cohu Inc. has been trading in an active band on the weekly chart, with price slipping from around $46 into the low‑$43 range before rebounding toward the mid‑$40s and then spiking above $52. That pattern suggests dip buying followed by a breakout attempt, with the $43 area acting as recent support and the low‑$50s now a key reference zone. For short-term traders, COHU has clearly shifted from a quiet pullback into a momentum phase.
The intraday 5‑minute snapshot reinforces that story. Price opened near the mid‑$47s and ripped to just above $50 while holding higher lows, then closed close to the session high. That kind of drive, with minimal intraday giveback, usually means real demand stepping in, and it often becomes a magnet level for future retests. Traders watching COHU should mark that $47 breakout area as the first pullback reference.
Financially, Cohu Inc. is a mixed picture. The latest quarterly revenue is about $149.0M, and trailing revenue is roughly $452.96M, but three‑ and five‑year revenue trends are negative, showing mid‑single‑digit declines per year. Gross margin near 75% is strong, yet EBIT margin of about -6.5% and a negative profit margin around -7.4% point to current earnings pressure despite a positive pretax margin. Balance sheet strength is a plus: low debt, a current ratio around 5.7, quick ratio roughly 4.5, and solid cash and short‑term investments provide cushion.
Conclusion
This is stock news, not investment advice. StocksToTrade News delivers real-time stock market updates tailored to highlight the key catalysts driving short-term price movements. Our coverage is designed for active traders and investors who thrive in fast-moving markets, with a focus on volatile sectors like penny stocks, AI stocks, Robinhood stocks and other momentum plays. From earnings reports and FDA approvals to mergers, new contracts, and unusual trading volume, we break down the events that can spark significant price action.
Looking to level up your trading game? Explore StocksToTrade, the ultimate platform for traders. With powerful tools designed for swing and day trading, integrated news scanning, and even social media monitoring, StocksToTrade keeps you one step ahead.
Check out our quick startup guide for new traders!
- How to Read Stock Charts: A Guide for Beginners
- Trading Plan: 6 Steps to Create One
- How To Create a Stock Watchlist
Ready to build your watchlists? Check out these curated lists:
Once your watchlist is set, take the next step and trade with confidence using StocksToTrade’s robust platform. Don’t miss out — grab your 14-day trial for just $7 and experience the edge you need to thrive in today’s fast-paced markets.