
CleanSpark Inc. stocks have been trading down by -15.64 percent after bearish sentiment over bitcoin volatility and mining profitability.
Key Takeaways
- Price action in CLSK shows a clear pullback from the $10 area to below $7, putting recent buyers underwater.
- Intraday trading in CleanSpark Inc. is showing a grind lower with heavy overhead supply between $7.50 and $8.50.
- Financials for CLSK reveal strong revenue growth but deep net losses and negative cash flow.
- The balance sheet for CleanSpark Inc. carries high long-term debt but also a sizable cash cushion and solid liquidity.
- Traders are watching whether CLSK can base above $6.50 or if momentum accelerates to the downside.
Live Update At 11:32:50 EST: On Wednesday, November 04, 2026 CleanSpark Inc. stock [NASDAQ: CLSK] is trending down by -15.64%! Discover the key drivers behind this movement as well as our expert analysis in the detailed breakdown below.
Quick Financial Overview
CLSK is a classic high-growth, high-burn story. CleanSpark Inc. posted about $766.3M in revenue over the trailing period, with revenue growth running hot — roughly 68% over three years and almost doubling over five. That kind of top-line ramp attracts momentum traders. But the bottom line tells a different story.
Profitability metrics for CLSK are deeply negative. Profit margin sits around -147%, EBIT margin near -149%, and return on equity below -70%. In simple terms, CleanSpark Inc. is spending a lot more than it brings in, even after accounting for non-cash charges. Operating cash flow was roughly -$112.3M in the latest quarter, with free cash flow at about -$118.4M.
More Breaking News
- RIOT Stock Slides As Wall Street Slashes Price Targets
- SK Hynix Rises 6% After Recent Pullback
- AEHL Stock Slides As Volatility Fades, Traders Eye Next Move
- SNDG ETF Slides As Volatility Pressures Bullish Traders
On the flip side, the balance sheet is not falling apart. CLSK holds around $202.6M in cash and over $794.7M when you include short-term investments, against roughly $1.78B in long-term debt. Liquidity ratios are strong, with a current ratio of about 5.9 and quick ratio of 5.1, giving CleanSpark Inc. room to keep operating and funding growth. Traders now have to weigh that runway against persistent losses.
Why Traders Are Watching CLSK Price Action
CLSK has shifted from breakout mode to grind-down mode. The daily chart shows CleanSpark Inc. fading from the $10.30 high on 2026/10/12 to about $6.80 on 2026/11/04. That’s a drawdown of roughly one-third in just a few weeks. For momentum traders, that is a clear trend change.
Look at the recent string of closes: above $10 mid-October, then a step down through the $9s and $8s, and now a loss of the $7 handle intraday before a weak bounce. Each lower high — $10.30, then $10.15, $9.75, $9.35, $9.07, and into the low-$8s — signals sellers in control. CLSK is now trading below earlier support in the $8.20–$8.60 zone, turning that area into hard resistance.
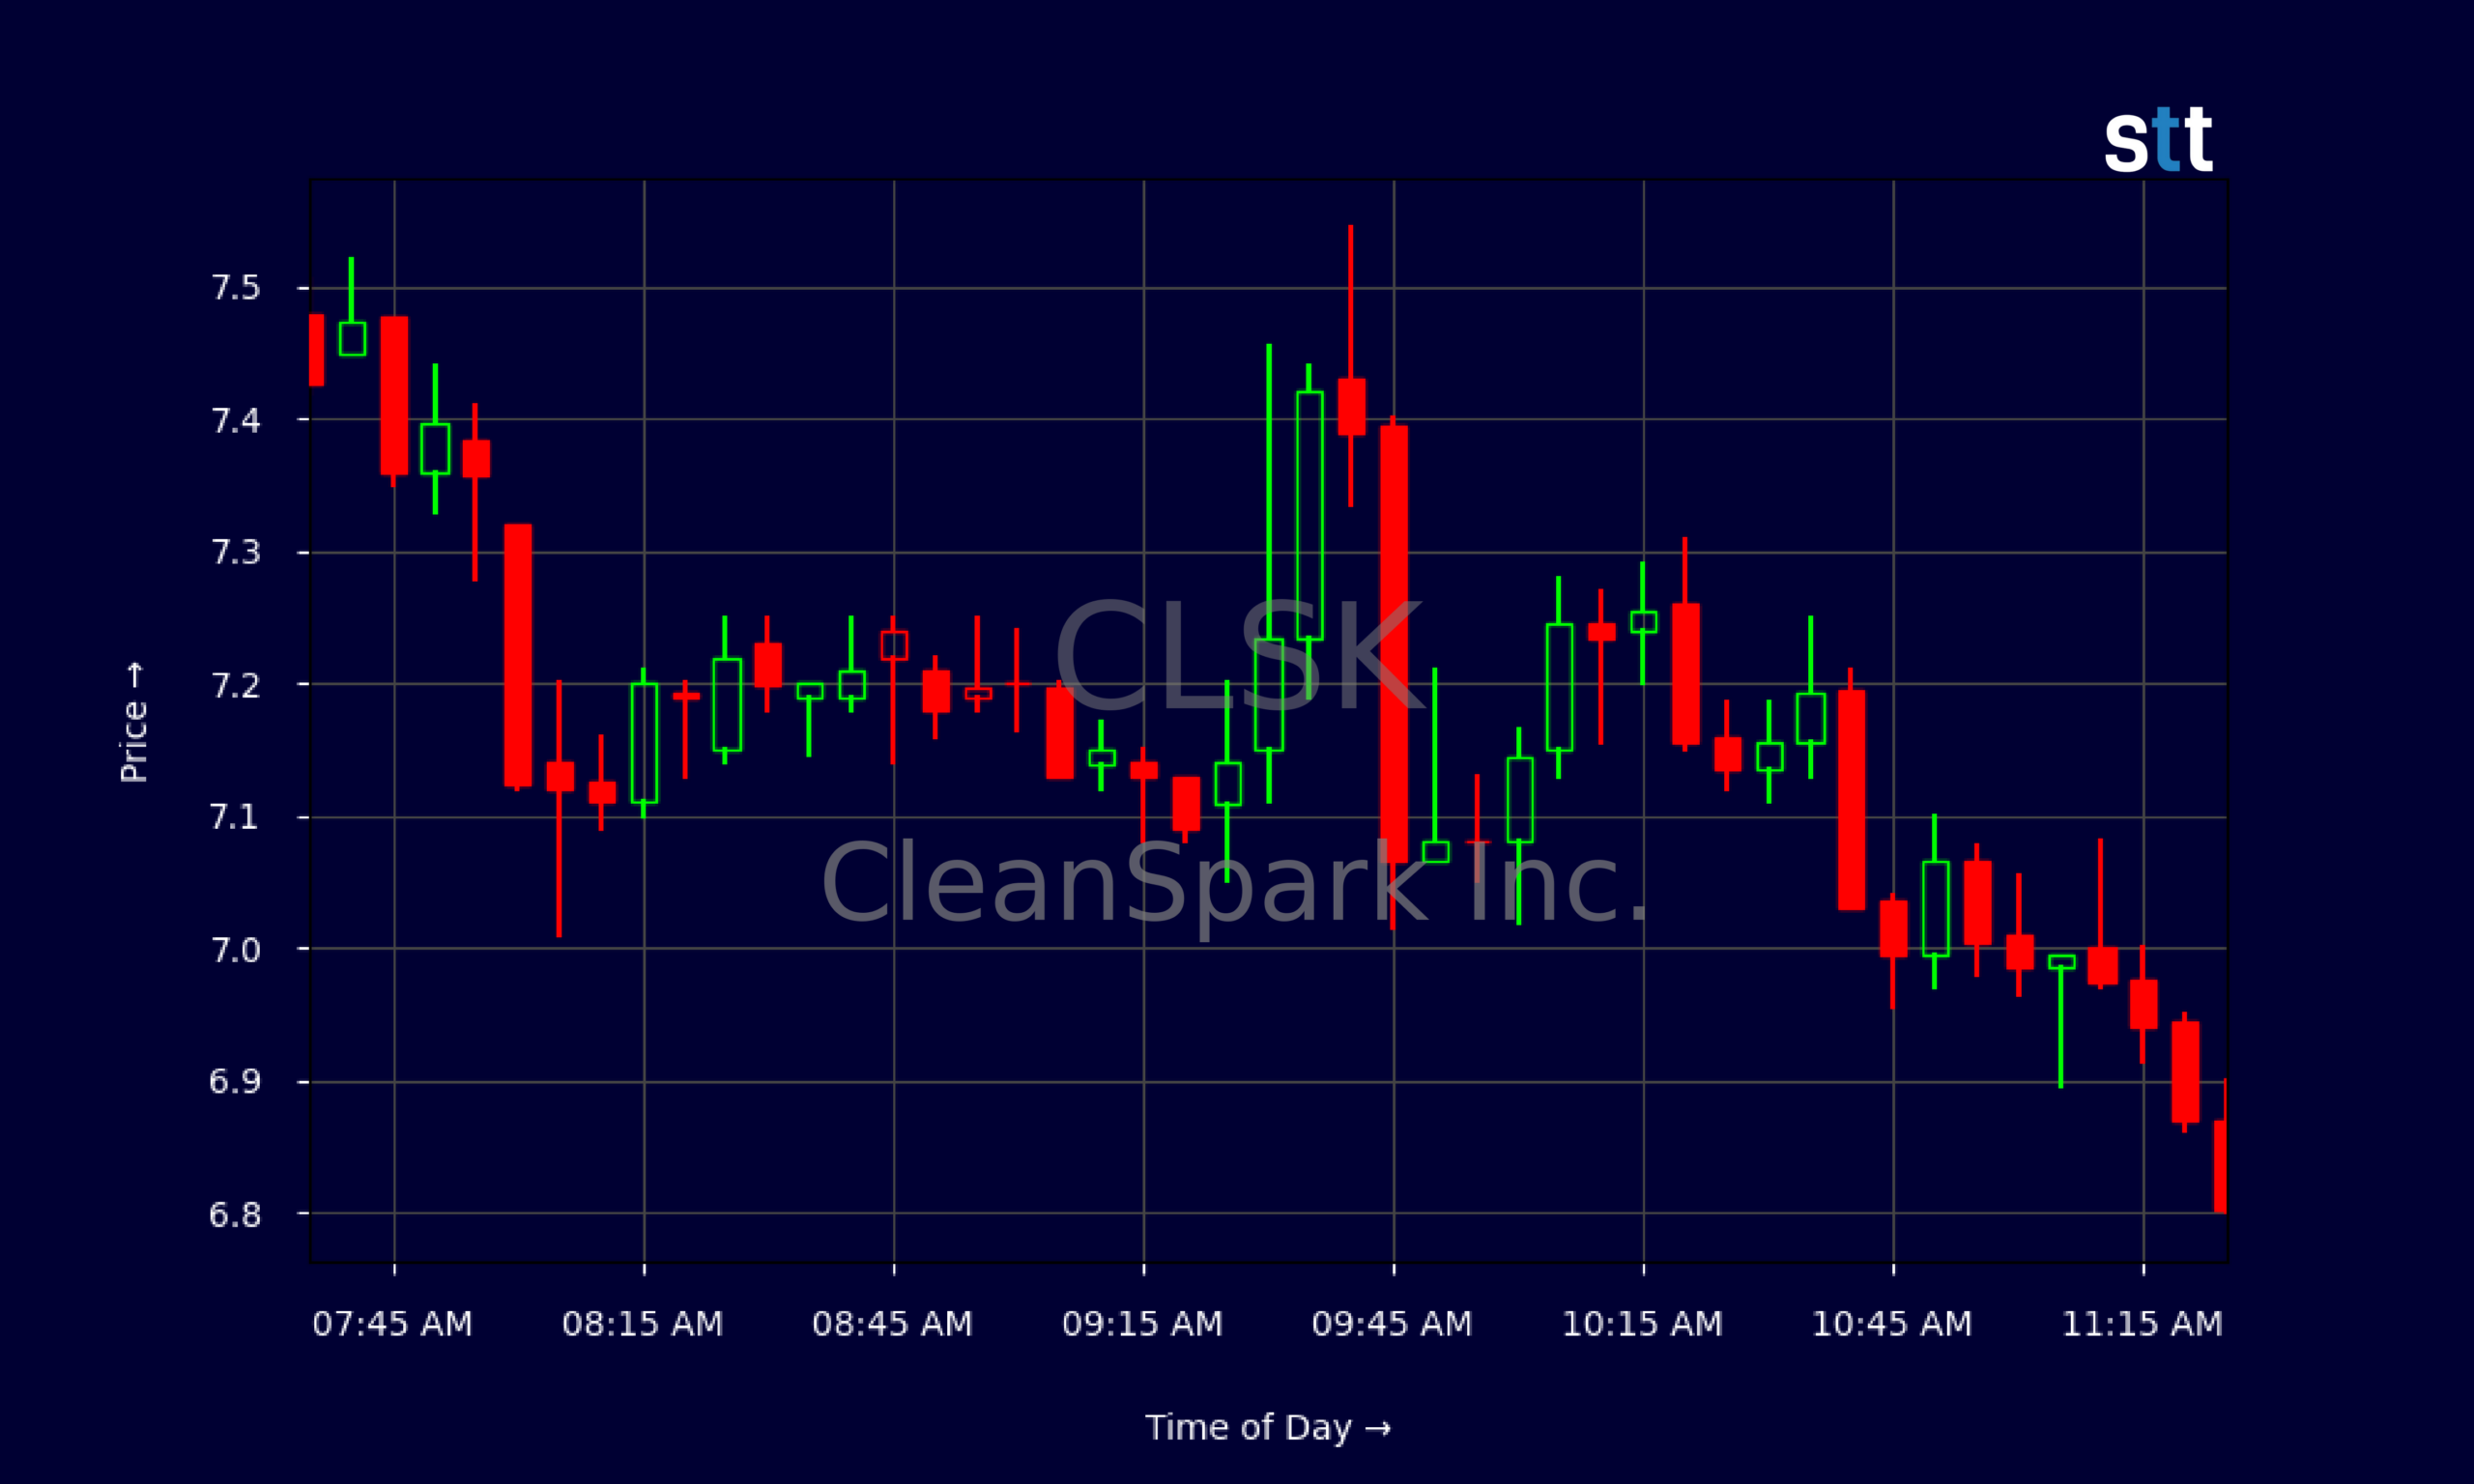
The 5‑minute chart for CleanSpark Inc. reinforces the story. Pre-market, CLSK sat in the mid‑$7s to low‑$7.8s range. Off the open, it failed to push past $7.55 and quickly flushed toward $7.00, then spent the rest of the morning stair-stepping lower into the high‑$6.70s. That’s classic intraday distribution — pops get sold, and support levels break one by one.
For active traders, CLSK is now a “respect risk first” ticker. CleanSpark Inc. still has a strong revenue growth narrative, but heavy losses, high debt, and the technical rollover create a potent mix. CLSK can bounce sharply thanks to prior volatility, yet the burden of proof has shifted to the long side. Until CleanSpark Inc. reclaims prior support levels with real volume, traders will treat bounces as potential short-term trading opportunities, not confirmation of a new uptrend.
Conclusion
CLSK sits at a key crossroads where story and numbers collide. CleanSpark Inc. is growing revenue fast and holds substantial cash, but the company is also carrying sizeable long-term debt and posting steep net losses. Negative margins, negative cash flow, and weak returns on capital all tell traders the business still has a lot to prove.
On the chart, the message is just as blunt. CLSK has broken down from the $10 zone, lost support in the $8s, and now fights to hold the upper‑$6s. CleanSpark Inc. intraday action shows steady selling pressure and failed bounces — a pattern that rewards disciplined, short-term trading but punishes anyone who overstays.
For active traders studying CLSK, this is a textbook case of why technicals and fundamentals both matter. CleanSpark Inc. offers volatility, liquidity, and a strong storyline, which is exactly what day traders look for. But chasing without a plan is how accounts blow up. As Tim Bohen, lead trainer with StocksToTrade says, “The best trades are the ones you can make without emotion. Plan it, then execute it as if it’s routine.” That mindset is crucial when you’re stalking volatile names like CLSK, where emotional entries and exits can quickly turn a good setup into an unnecessary loss.
As Tim Sykes loves to remind his students, “Trade like a sniper, not a machine gun.” With CLSK, that means waiting for clean levels, cutting losses fast, and letting the chart of CleanSpark Inc. — not hope — call the shots. This analysis is for educational and research purposes only and is not investment advice.
This is stock news, not investment advice. StocksToTrade News delivers real-time stock market updates tailored to highlight the key catalysts driving short-term price movements. Our coverage is designed for active traders and investors who thrive in fast-moving markets, with a focus on volatile sectors like penny stocks, AI stocks, Robinhood stocks and other momentum plays. From earnings reports and FDA approvals to mergers, new contracts, and unusual trading volume, we break down the events that can spark significant price action.
Looking to level up your trading game? Explore StocksToTrade, the ultimate platform for traders. With powerful tools designed for swing and day trading, integrated news scanning, and even social media monitoring, StocksToTrade keeps you one step ahead.
Check out our quick startup guide for new traders!
- How to Read Stock Charts: A Guide for Beginners
- Trading Plan: 6 Steps to Create One
- How To Create a Stock Watchlist
Ready to build your watchlists? Check out these curated lists:
Once your watchlist is set, take the next step and trade with confidence using StocksToTrade’s robust platform. Don’t miss out — grab your 14-day trial for just $7 and experience the edge you need to thrive in today’s fast-paced markets.