

Atlas Energy Solutions Inc. stocks have been trading down by -7.36 percent following bearish sentiment over weakening energy demand.
What Traders Need To Know
- Price dropped from the mid-$16s toward $14.47, signaling sharp near-term selling pressure.
- Intraday range between $16.15 and $14.21 highlights elevated volatility and fast momentum shifts.
- Revenue around $1.10B with thin gross margin near 10% points to a low-margin operating model.
- Net losses and negative EBITDA offset steady top-line growth, creating a conflicting picture for swing trades.
- Debt levels are manageable but cash flow is tight, so Atlas Energy Solutions Inc. remains a higher-risk trading vehicle.
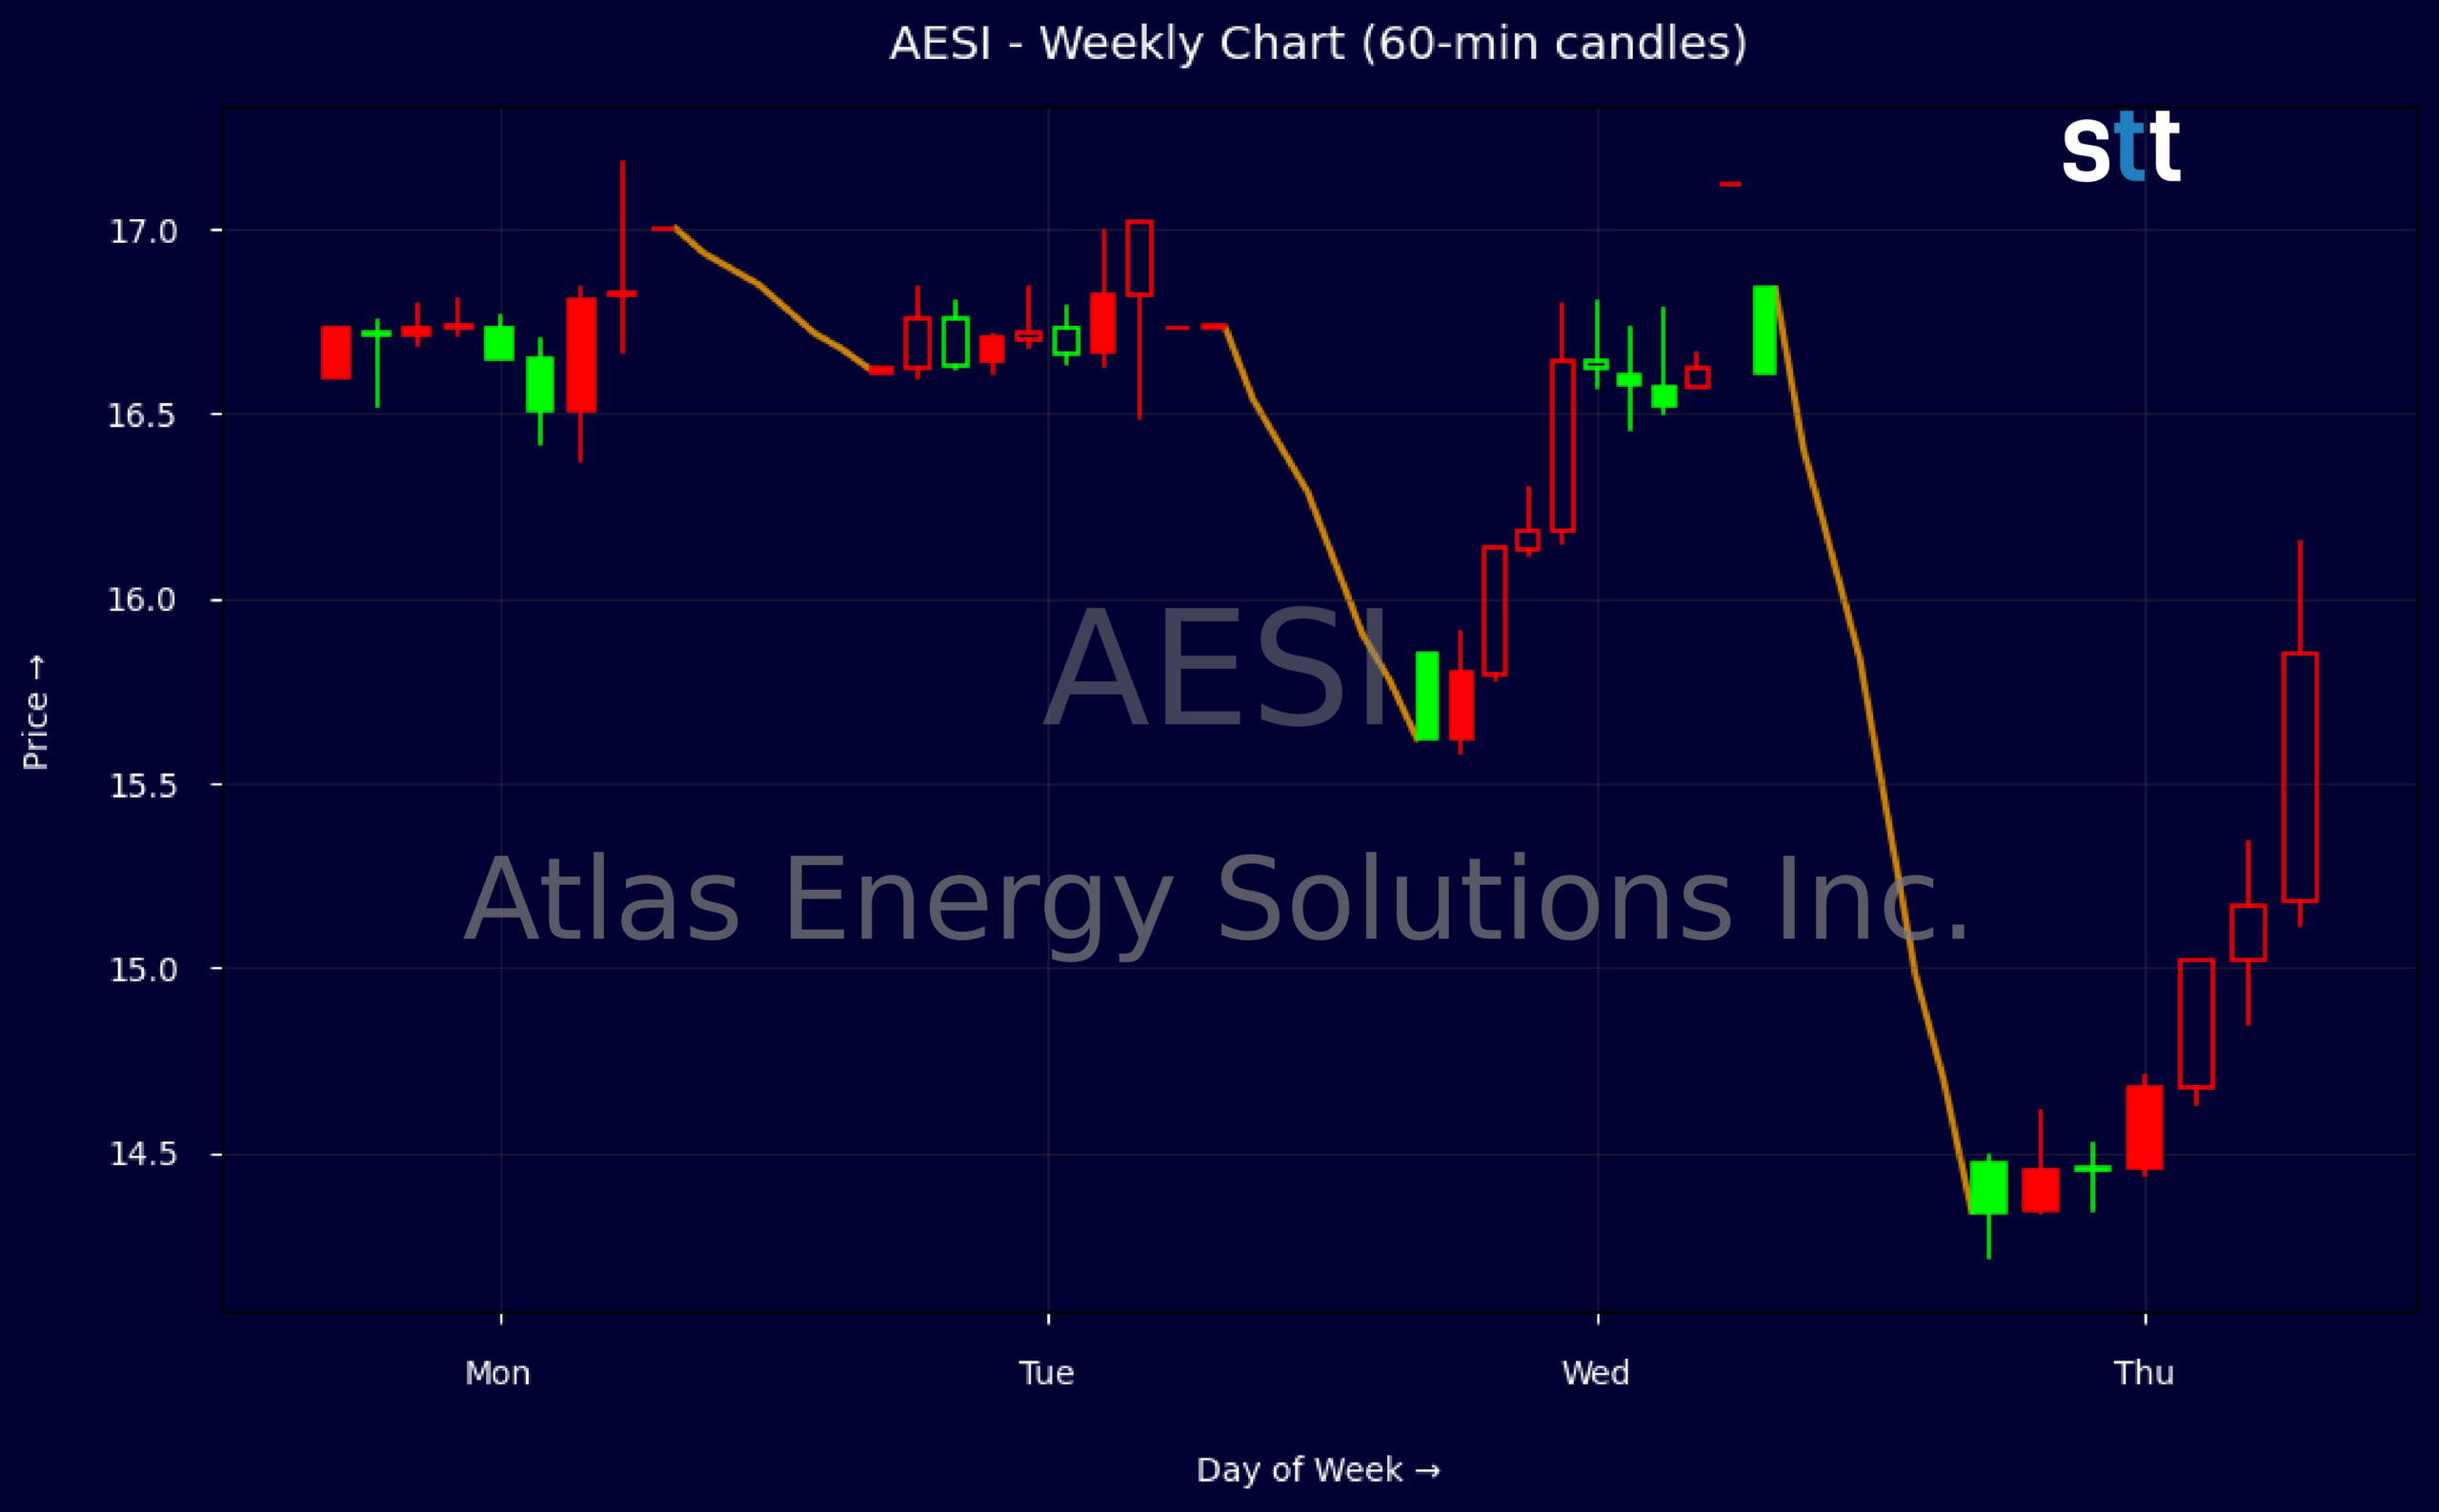
Weekly Update Jun 29 – Jul 03, 2026: On Sunday, July 05, 2026 Atlas Energy Solutions Inc. stock [NYSE: AESI] is trending down by -7.36%! Discover the key drivers behind this movement as well as our expert analysis in the detailed breakdown below.
Energy industry expert:
Analyst sentiment – negative
AESI sits in a weak but not distressed fundamental position. Revenue of ~$1.1B with 90%+ three‑year growth shows strong scaling, yet profitability is poor: EBIT margin -5.4%, gross margin only 9.6%, and LTM ROE about -8%. Q1 2026 delivered a $47m net loss and negative free cash flow of ~$10m despite positive operating cash flow, reflecting heavy capex and working‑capital swings. Leverage is moderate (debt/equity 0.59, current ratio 1.2), and equity cushion remains solid (P/B ~1.9).
Technically, AESI has broken down. The recent sequence from 16.73 to 14.47 in just a few sessions is a steep weekly decline, confirming a short‑term bearish trend after failing to hold the 16.60–16.70 area. Intraday 5‑minute candles show persistent supply on bounces with expanding volume on down moves, indicating distribution. The first actionable level is resistance at ~$15.80–16.00; rallies into that band favor short entries with stops above 16.30 and near‑term downside focus toward 14.00.
More Breaking News
- MPT Stock Slides As Traders Weigh Debt, Dividend Risk
- BMNR Stock Pulls Back As Traders Gauge Risk
- BBAI Stock Pops As BigBear.ai Lands $225M In Federal AI Deals
- NRXP Stock Builds Momentum As FDA Ketamine Catalyst Nears
With no fresh company‑specific news, the tape and fundamentals drive the outlook. Versus broader Energy and Fossil Fuels peers, AESI screens weaker on margins and returns, and trades at a rich price‑to‑cash‑flow multiple for a loss‑making operator. Near term, I see limited justification for multiple expansion. Expect resistance near $16 and support in the $13.50–14.00 zone; base‑case 3–6 month trading range is $13–17, skewed to the downside.
Quick Financial Overview
Atlas Energy Solutions Inc. (AESI) shows weekly price action turning lower, with the stock sliding from roughly $16.70 to $14.47 over a few sessions. That is a meaningful pullback and tells traders that supply is in control for now. The intraday print between about $16.15 on the high and $14.21 on the low confirms aggressive selling pressure and wide ranges, a backdrop that suits short-term momentum traders but demands tight risk control.
On the fundamental side, AESI generated about $1.10B in revenue, equal to roughly $8.77 per share, but only around 9.6% gross margin. Profitability metrics are weak: EBIT margin is negative, profit margin is about -9%, and EBITDA is firmly below zero in the latest quarter. The company posted a quarterly net loss near $47.3M, with operating income also in the red. That combination signals a company still fighting to convert sales into consistent earnings.
Valuation ratios show the market is paying about 2.04x sales and around 1.86x book value, not extreme, but high when paired with negative earnings and stressed cash generation. Free cash flow ran negative by roughly $10.3M in the quarter, while capital spending near $25.9M and net debt issuance show reliance on financing to fund growth. The balance sheet is not over-levered, with total debt-to-equity around 0.59 and a current ratio near 1.2, but liquidity is only modest, which matters if market or sector conditions tighten.
Conclusion
Atlas Energy Solutions Inc. is trading in a weak short-term trend after the drop from the mid-$16s to the mid-$14s, and the wide intraday range reinforces that sellers have the upper hand. For traders, that means any bounce in AESI toward prior support-turned-resistance should be treated as a potential fade zone unless volume and tape action clearly flip back in favor of buyers. As Tim Bohen, lead trainer with StocksToTrade says, “Success in trading is more about cutting losses quickly than finding winners.”, and that mindset is especially relevant here when defining risk on any short-term bounce or breakdown. The mix of negative margins, negative EBITDA, and ongoing capital spending translates into a fundamentally fragile backdrop that can magnify moves in either direction.
At the same time, AESI carries over $1.10B in assets and more than $1.16B in equity, with total debt-to-equity under 0.6, so this is not a balance-sheet-at-risk story in the near term. It is a cash-flow and execution story, where traders must watch whether management can move from revenue growth to true operating leverage. From a trading-education standpoint, this is a classic case of aligning weak fundamentals with a deteriorating chart and then deciding whether your edge is on the short side or waiting for a confirmed base. As the trading expert behind this analysis, I will repeat the rule I teach every day: “Price action always gets the final vote, so let Atlas Energy Solutions Inc. show you real strength or real breakdown before you size up a trade.””,”scores”:{“risk-level”:”high”},”trade”:”false
This is stock news, not investment advice. StocksToTrade News delivers real-time stock market updates tailored to highlight the key catalysts driving short-term price movements. Our coverage is designed for active traders and investors who thrive in fast-moving markets, with a focus on volatile sectors like penny stocks, AI stocks, Robinhood stocks and other momentum plays. From earnings reports and FDA approvals to mergers, new contracts, and unusual trading volume, we break down the events that can spark significant price action.
Looking to level up your trading game? Explore StocksToTrade, the ultimate platform for traders. With powerful tools designed for swing and day trading, integrated news scanning, and even social media monitoring, StocksToTrade keeps you one step ahead.
Check out our quick startup guide for new traders!
- How to Read Stock Charts: A Guide for Beginners
- Trading Plan: 6 Steps to Create One
- How To Create a Stock Watchlist
Ready to build your watchlists? Check out these curated lists:
Once your watchlist is set, take the next step and trade with confidence using StocksToTrade’s robust platform. Don’t miss out — grab your 14-day trial for just $7 and experience the edge you need to thrive in today’s fast-paced markets.