

American Airlines Group Inc. stocks have been trading down by -3.87 percent amid headlines spotlighting weakening travel demand and rising costs.
Key Takeaways
- Management slashed 2026 adjusted EPS guidance to a $1.60–$1.00 loss, versus a prior range of -$0.65–$0.65, as higher fuel adds roughly $2.8B in Q4 costs versus 2025.
- For Q4, AAL expects an adjusted EPS loss of $1.10–$0.50, well below the consensus loss of $0.41, even as revenue is guided up 19.5%–22.5%.
- The airline now forecasts 2026 fuel expense more than $7B above 2025, pointing to structurally higher operating costs and weaker profitability.
- Management says profitability is under pressure across the industry and expects AAL’s 2027 growth rate to slow sharply, hinting at a cooler long‑term expansion path.
- UBS widened its projected Q4 loss for AAL and cut its price target, but kept a Buy rating, while noting Delta’s stronger guidance makes American’s earnings look more fragile.
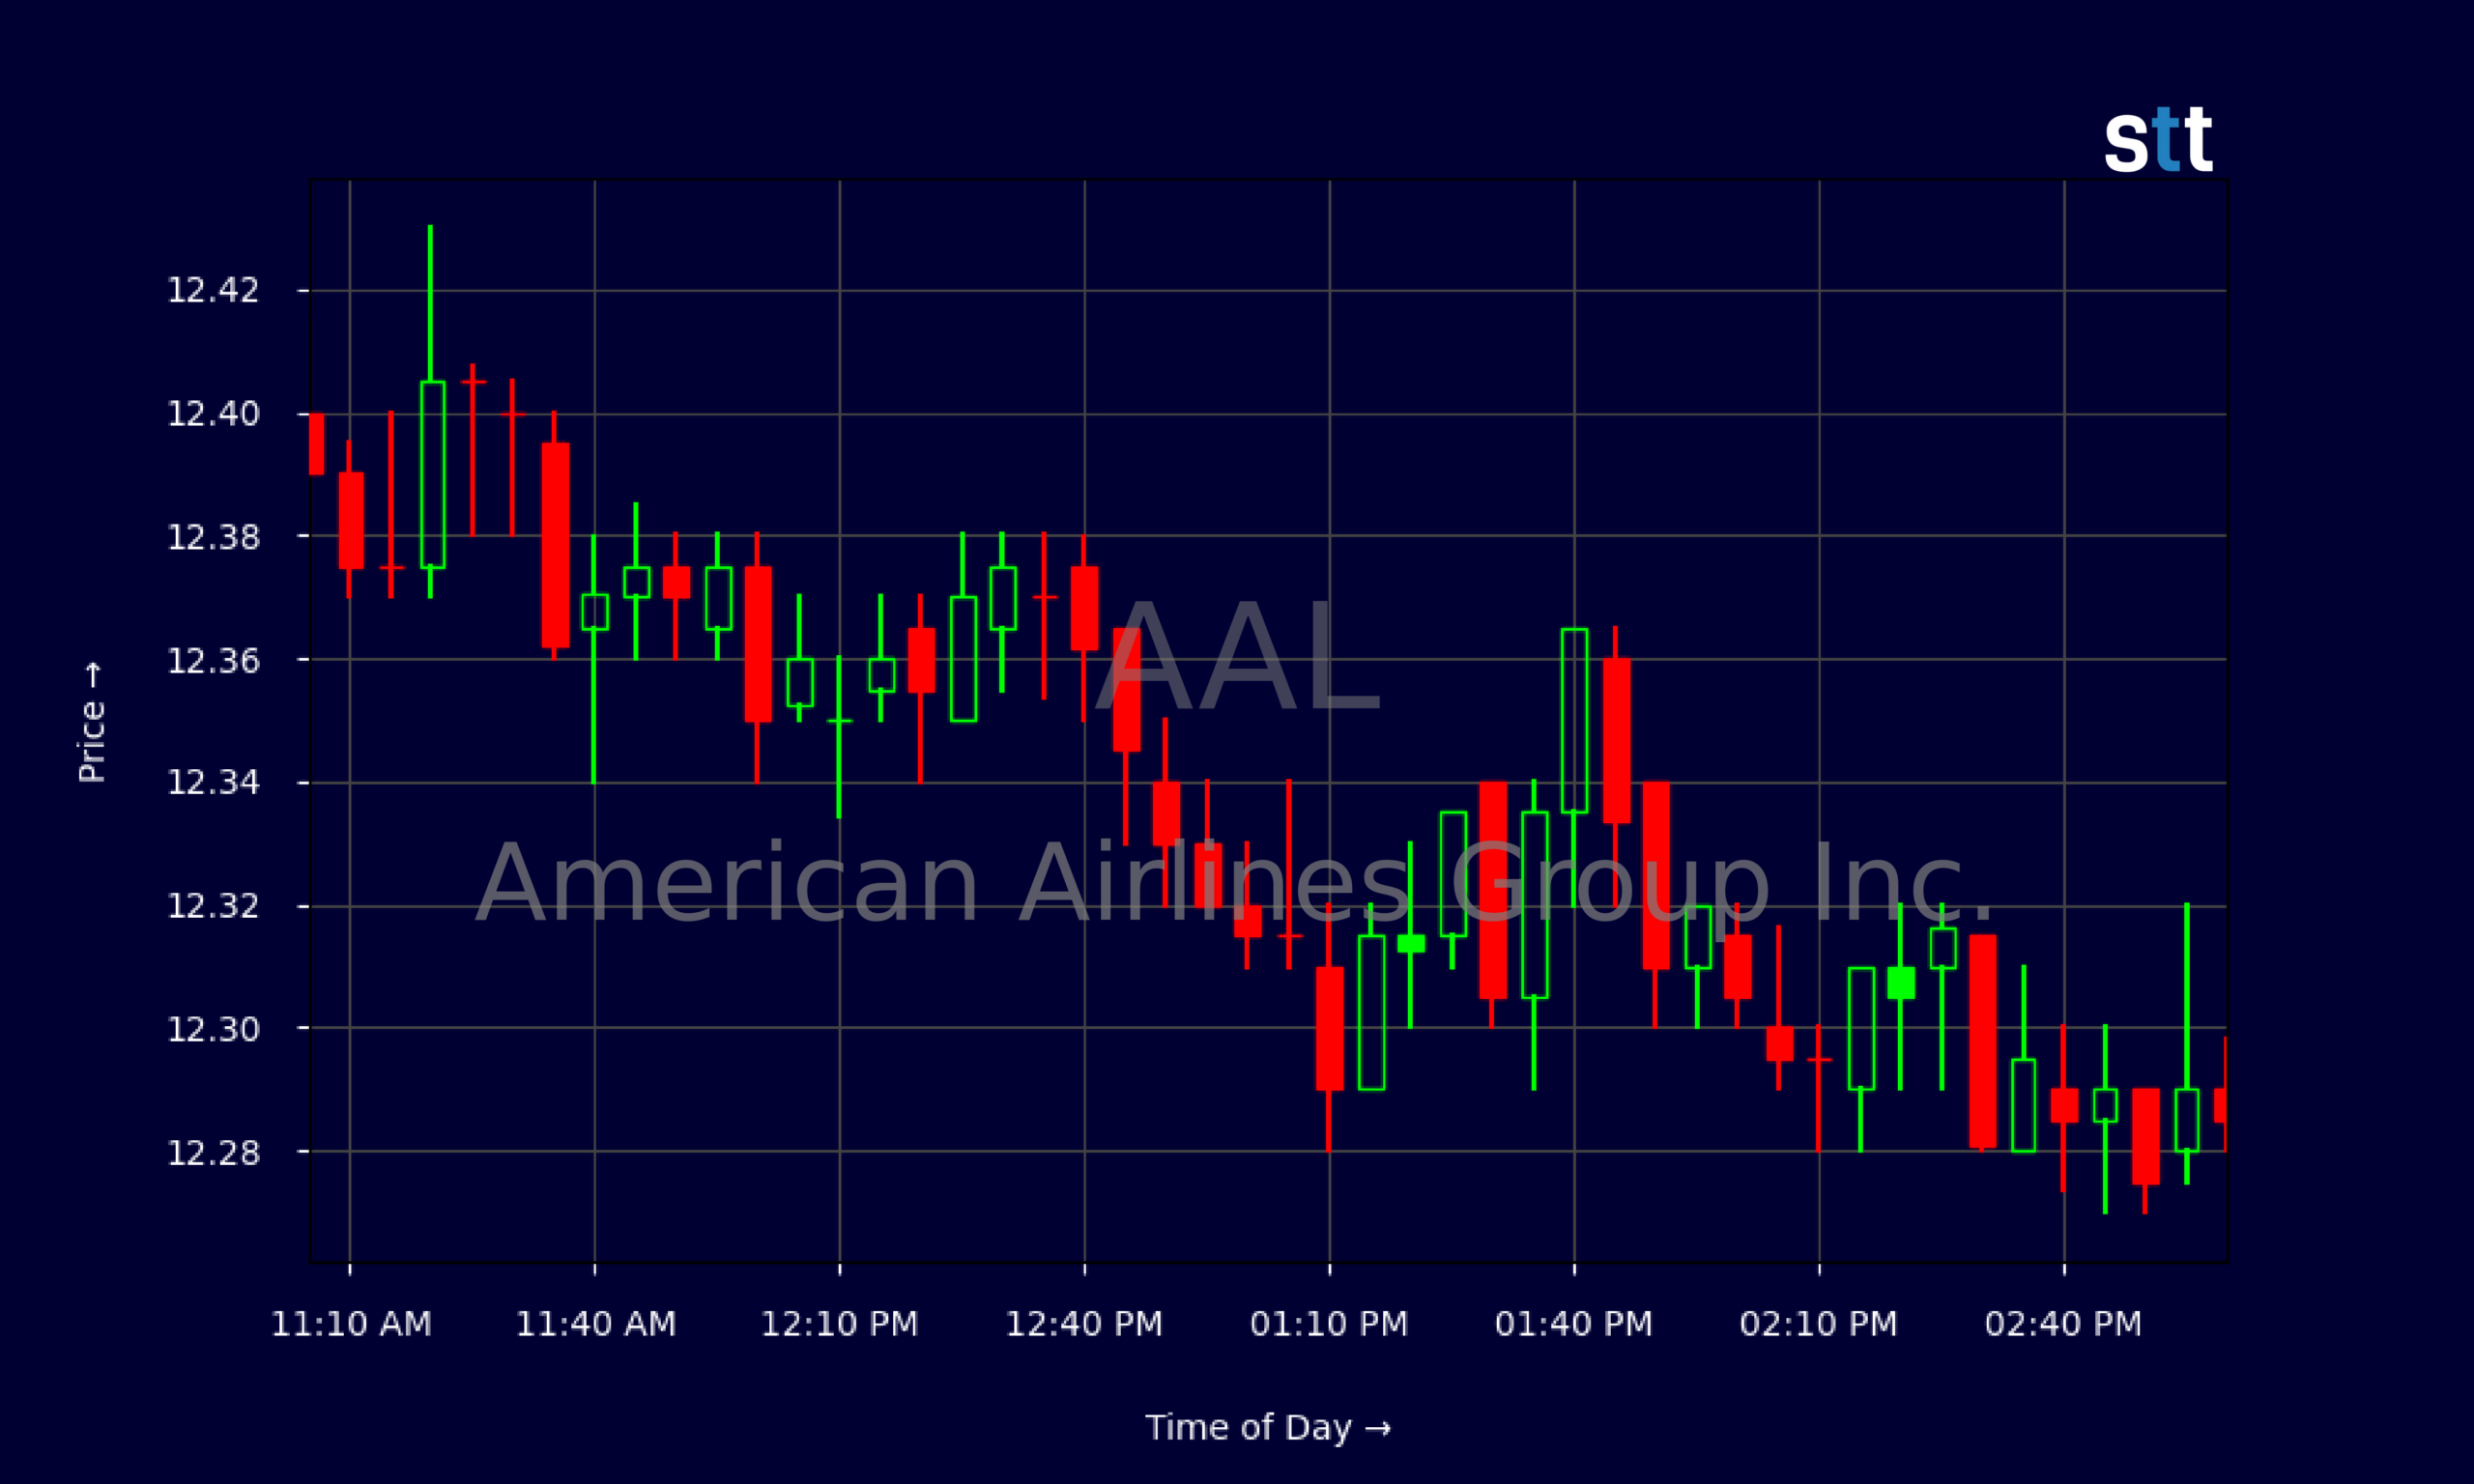
Live Update At 15:03:46 EDT: On Friday, October 30, 2026 American Airlines Group Inc. stock [NASDAQ: AAL] is trending down by -3.87%! Discover the key drivers behind this movement as well as our expert analysis in the detailed breakdown below.
Quick Financial Overview
On the chart, AAL has been stuck in a tight, choppy range. Over the past couple of weeks, American Airlines Group Inc. has oscillated mostly between $11.70 and $13.00, closing near $12.29 on 2026/10/30. That puts AAL toward the lower half of its recent band, which tells traders the market is not willing to pay up given the new loss guidance.
Intraday, AAL’s tape on the latest session shows a slow bleed from the $12.60s in premarket toward the low $12.20s into the close, with plenty of small, overlapping 5‑minute candles. That kind of tight, low‑range action usually signals indecision, not aggressive accumulation. For short‑term trading, it favors quick scalps over swing holds.
More Breaking News
- AMZN Stock Under Pressure As Rivals Target Core Businesses
- SPCX Slides As Headline Risk And Competition Hammer Sentiment
- BBAI Stock Pops As BigBear.ai Lands $225M In Federal AI Deals
- BMNR Stock Holds Key Range As Traders Track Cash-Fueled Turnaround
Fundamentally, American Airlines reported Q3 2026 revenue of $16.34B but still booked a net loss of $269M, or -$0.41 per share. EBITDA was just $101M on a massive cost base, including $4.64B of fuel. AAL carries heavy leverage: about $31.55B in long‑term debt, negative equity, a current ratio of 0.5, and thin interest coverage at 2.1 times. The revenue engine is strong, but the balance sheet and margins keep this firmly in turnaround territory rather than a clean growth story.
Why Traders Are Watching AAL So Closely
The latest news flow around American Airlines Group Inc. explains why traders are glued to the AAL chart. The company beat Q3 expectations on both revenue and loss per share, yet the stock dropped about 4% premarket after the print. The reason is simple: guidance, not the quarter, is driving the narrative.
AAL now expects 2026 adjusted EPS to land between a $1.60 and $1.00 loss, a dramatic reset from the prior range of -$0.65–$0.65 and far below the Street’s earlier $0.98 profit outlook. Management tied that shift to a fuel shock, with 2026 fuel expense projected to run more than $7B above 2025, and roughly $2.8B of extra fuel cost in Q4 alone versus the prior year. For traders, that’s the core problem: even strong demand can’t outrun that kind of cost surge.
Near term, AAL guided Q4 adjusted EPS to a loss of $1.10–$0.50, materially worse than the consensus loss of $0.41, while still calling for 19.5%–22.5% revenue growth and only modest capacity and cost increases. That split — hot revenue, cold earnings — tells you demand is not the issue. Margin pressure is.
UBS responded by widening its projected Q4 loss for American Airlines, trimming its price target but keeping a Buy rating. At the same time, Delta’s stronger guidance makes AAL look weaker on a relative basis, which matters for sector rotation trades. Add in management’s warning that profitability is under pressure for all carriers and that 2027 growth will “decelerate considerably,” and you get a multi‑year caution signal. For active traders, that usually means watching for sentimental overreactions — sharp sell‑offs, relief rallies, short squeezes — rather than betting on a smooth grind higher.
Conclusion
For American Airlines Group Inc., the story right now is not about demand. It is about costs, leverage, and time. AAL is growing revenue and filling planes, but the guidance reset shows how quickly an external shock — in this case, fuel — can flip the earnings script. With 2026 losses now expected to deepen, 2027 growth expected to slow, and industry‑wide profitability “under pressure,” the market is re‑rating AAL’s risk profile.
That doesn’t make AAL untradeable. It just changes how traders should think about it. This becomes a name where guidance headlines, fuel headlines, and peer comps (especially Delta) can spark big moves both ways. The recent tight range around $12 shows traders are still digesting the new outlook; a decisive break above or below that band could set up the next momentum leg. In this kind of reactive tape, discipline around entries and exits becomes critical; as Tim Bohen, lead trainer with StocksToTrade says, “I never chase price. The best opportunities allow me to enter on my terms, not when I’m feeling pressured.” That mindset can help traders avoid emotional entries when AAL spikes on headlines and instead wait for cleaner, more predictable setups.
For education‑focused traders, AAL is a clean case study in why guidance and cost structure matter more than a single quarter’s beat. As Tim Sykes loves to say, “The market doesn’t care about your opinion, only the price action — so adapt or get left behind.” This analysis is for educational and research purposes only and is not trading advice, but it lays out the key numbers and trends so traders can build their own, disciplined game plan around AAL.
This is stock news, not investment advice. StocksToTrade News delivers real-time stock market updates tailored to highlight the key catalysts driving short-term price movements. Our coverage is designed for active traders and investors who thrive in fast-moving markets, with a focus on volatile sectors like penny stocks, AI stocks, Robinhood stocks and other momentum plays. From earnings reports and FDA approvals to mergers, new contracts, and unusual trading volume, we break down the events that can spark significant price action.
Looking to level up your trading game? Explore StocksToTrade, the ultimate platform for traders. With powerful tools designed for swing and day trading, integrated news scanning, and even social media monitoring, StocksToTrade keeps you one step ahead.
Check out our quick startup guide for new traders!
- How to Read Stock Charts: A Guide for Beginners
- Trading Plan: 6 Steps to Create One
- How To Create a Stock Watchlist
Ready to build your watchlists? Check out these curated lists:
Once your watchlist is set, take the next step and trade with confidence using StocksToTrade’s robust platform. Don’t miss out — grab your 14-day trial for just $7 and experience the edge you need to thrive in today’s fast-paced markets.