

AlTi Global Inc. faces heightened bearish sentiment after its latest strategic and financial update, as stocks have been trading down by -11.98 percent.
Market Insights For Active Traders
- Weekly chart shows a sharp drop from around $3.84 to $3.38, signaling fresh selling pressure.
- Intraday action saw a hard flush from above $3.80 down near $3.00 before a weak bounce.
- Recent quarterly numbers show negative margins and losses despite more than $58M in revenue.
- Balance sheet carries low debt relative to equity, giving AlTi Global Inc. room to adjust.
- Traders are watching whether the $3.00–$3.40 zone turns into a base or breaks lower.
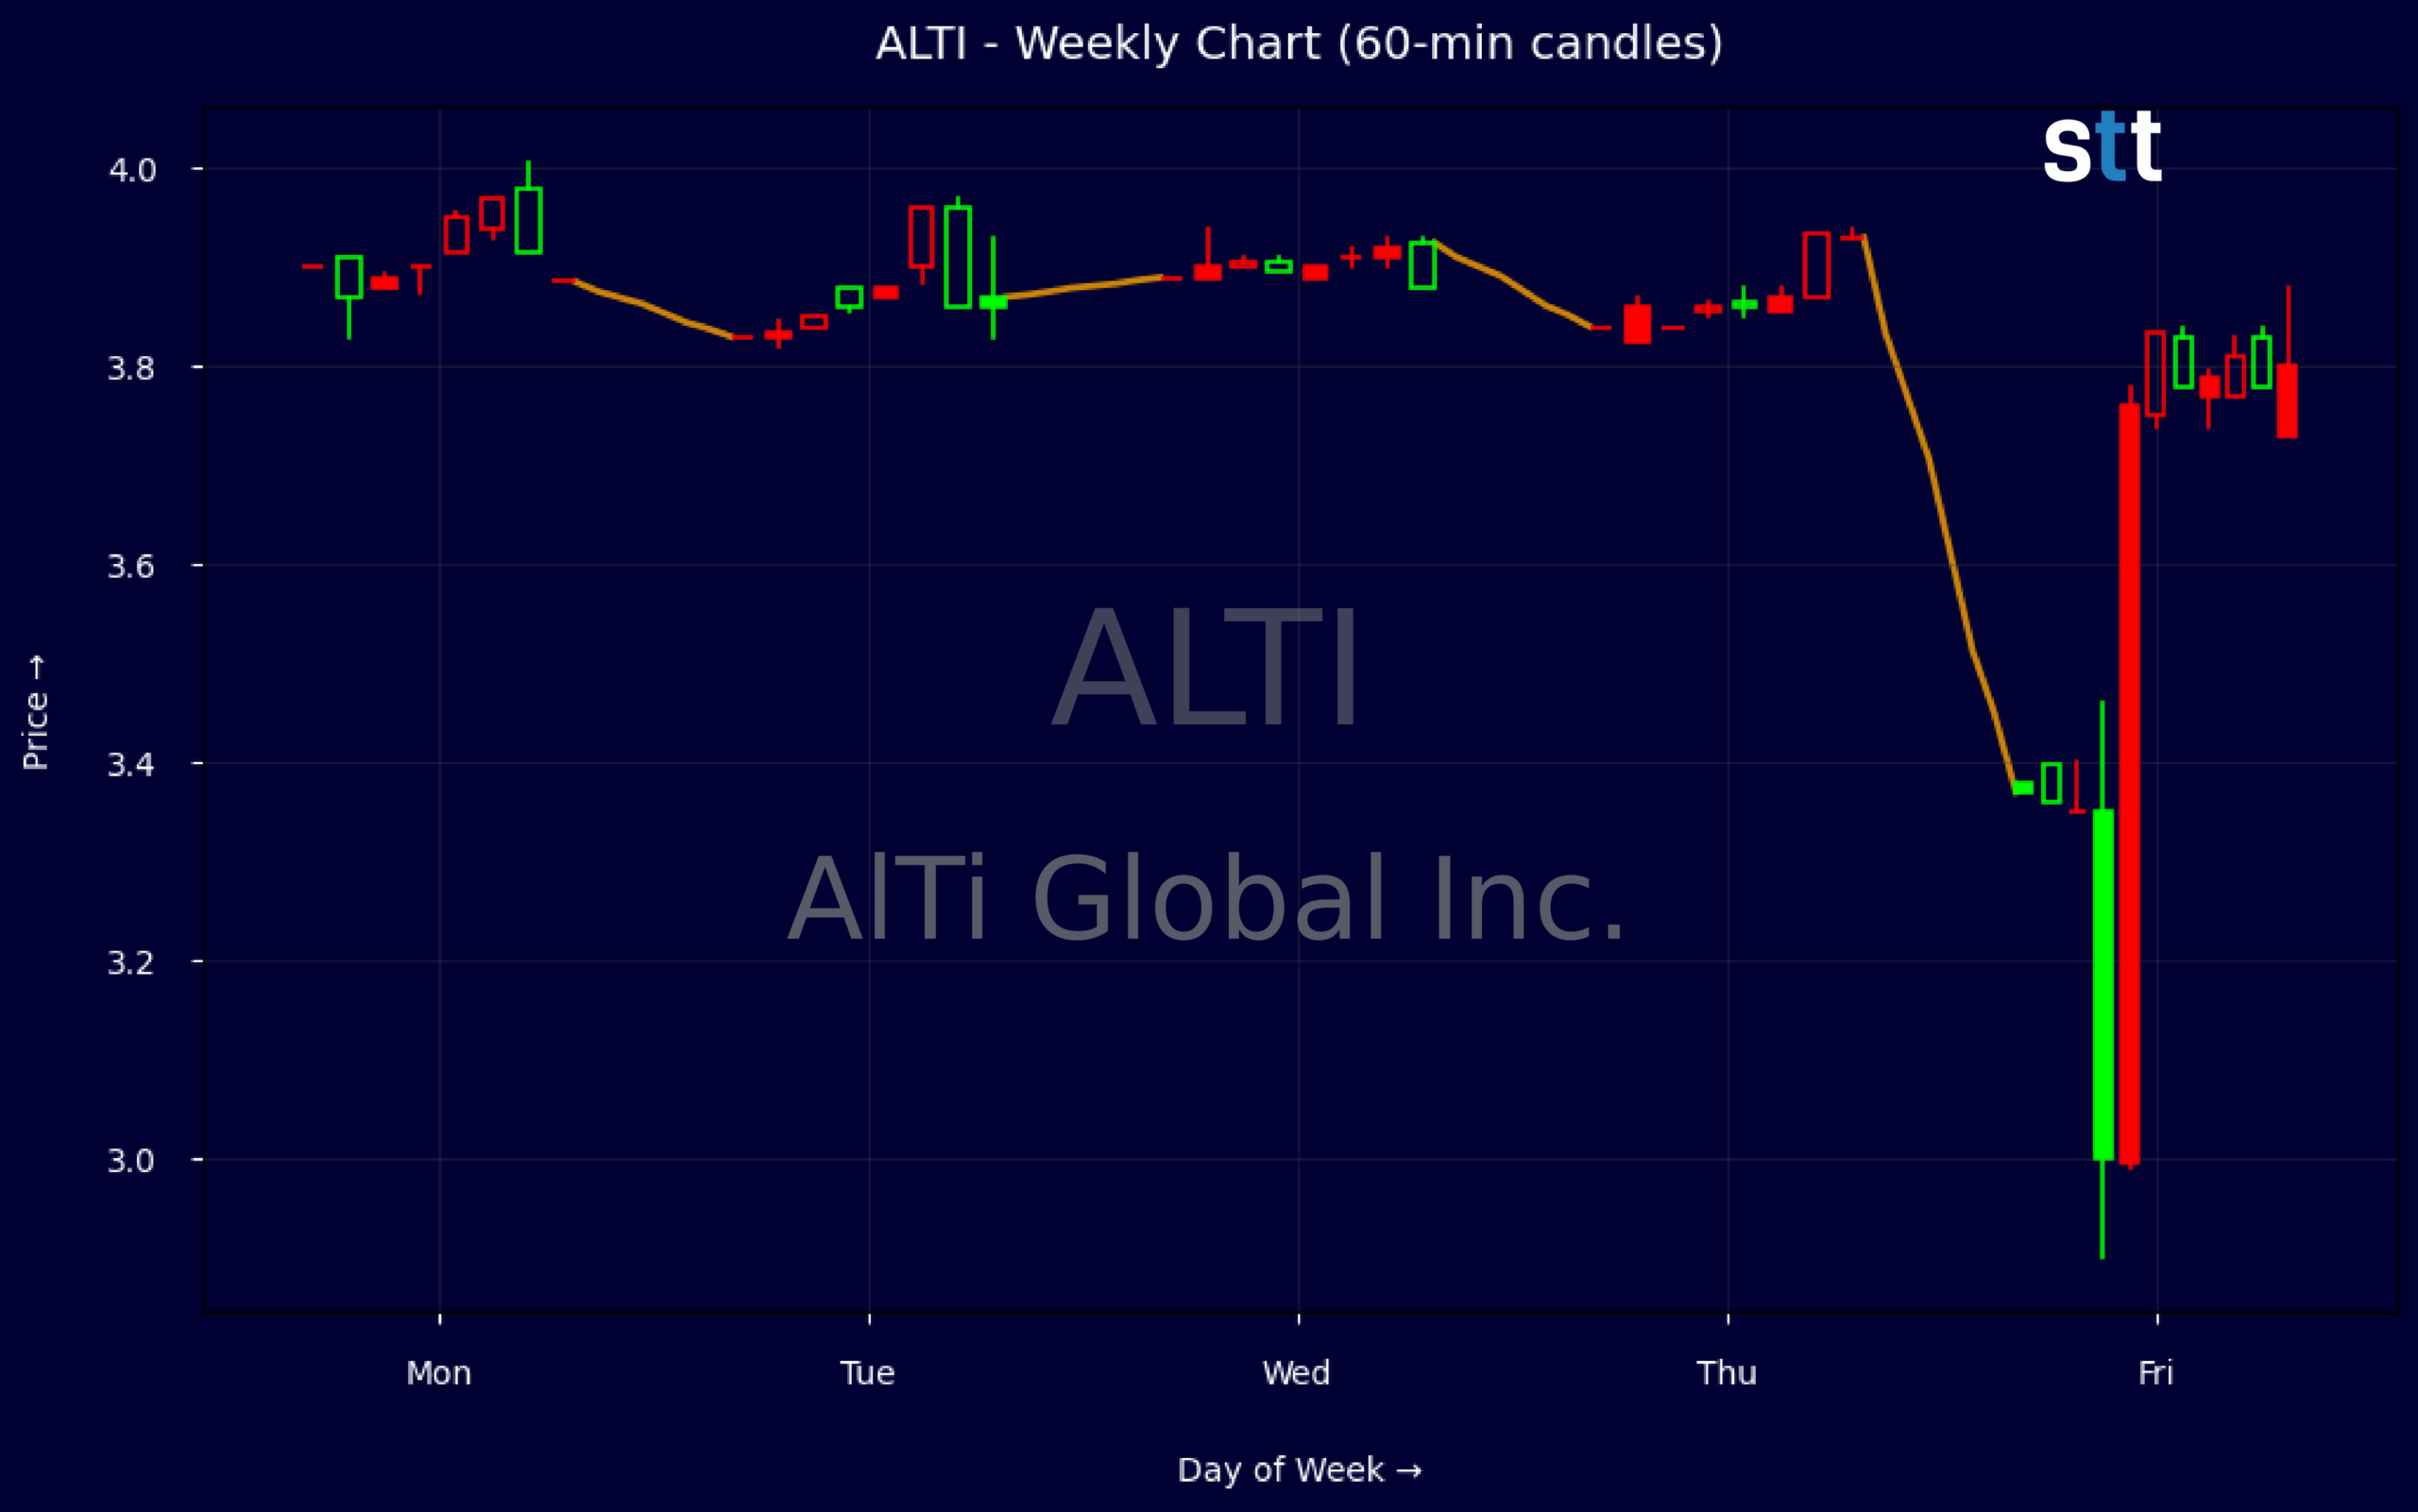
Weekly Update Aug 31 – Sep 04, 2026: On Sunday, September 06, 2026 AlTi Global Inc. stock [NASDAQ: ALTI] is trending down by -11.98%! Discover the key drivers behind this movement as well as our expert analysis in the detailed breakdown below.
Finance industry expert:
Analyst sentiment – negative
AlTi Global (ALTI) is a subscale, loss-making alternative asset and wealth manager with weak profitability and underutilized assets. LTM EBIT margin of roughly -26.5% and profit margin of about -41% underscore structural inefficiency despite ~$255m revenue and double‑digit three‑year growth. Returns are deeply negative (ROE ~-17%, ROIC ~-17%), while cash burn persists (Q2-26 operating cash flow -$2.4m, FCF -$3.2m). Balance sheet is solid (debt/equity 0.12, price/book ~0.98), but goodwill-heavy and reliant on intangibles.
Technically, ALTI trades in a tight, illiquid band, with the weekly tape clustering between $3.80–3.90 before a volatility spike to a $2.90 low and $3.46 high, closing $3.38. The dominant trend is weakly downward, with clear supply near $3.90 and fragile support around $3.00. With thin 5‑minute volume and wide intraday ranges, liquidity risk is material. A specific actionable level: $3.00 as a hard stop for longs; entries only on sustained reclaim of $3.75–3.80.
More Breaking News
- Global Payments Stock Climbs As Analysts Hike Price Targets
- CareDx CDNA Rips Higher After Big Earnings Beat And Guidance Hike
- Pinterest Stock Slips As Revenue Misses Rattle Traders
- REGN Jumps As Libtayo Data And Analyst Upgrades Fuel Bullish Outlook
With no meaningful recent news flow, the stock’s underperformance versus diversified asset management peers (which typically earn mid‑teens ROE and positive operating margins) reflects real fundamental gaps, not sentiment dislocation. Absent visible catalysts (AUM scale-up, margin inflection, or strategic transactions), ALTI warrants a cautious stance. Near-term resistance is $3.90, support $3.00; base-case trading range $3.00–4.00 with a 6–12 month fair value bias toward ~$3.25 unless profitability improves materially.
Quick Financial Overview
AlTi Global Inc. (ALTI) is trading in the low single digits, with the latest weekly bar closing near $3.38 after opening around $3.90. That move reflects a clear shift in control from buyers to sellers, with the range extending down toward $2.90 intraw eek. For short-term traders, this kind of wide weekly candle often marks either the start of a trend leg or a short-term capitulation area that can attract active trading.
The intraday 5‑minute data backs that up: price opened near $3.80, briefly tagged $3.88, then washed down to just under $3.00 before settling near $3.00. That is a heavy intraday fade, showing aggressive supply hitting bids. Such action in ALTI usually means day traders are in control, and swing traders should be cautious about chasing moves without clear confirmation of support.
Financially, AlTi Global Inc. is a mixed picture. Revenue sits around $255M with solid top‑line growth over three years, but profit metrics are deeply negative, with pretax and net margins both in the red. Key ratios show a price‑to‑sales near 1.7 and price‑to‑book just under 1, suggesting the market is not paying a premium for the stock. Debt levels look moderate, with total debt to equity near 0.12 and working capital positive, but operating cash flow is negative, which keeps pressure on management to improve execution.
Conclusion
From a trading standpoint, ALTI is in a vulnerable but active zone. The breakdown from the mid‑$3.80s toward the low $3s on the weekly chart, combined with the intraday flush toward $3.00, tells you sellers have the upper hand for now. At the same time, the price close to stated book value per share around $3.92 suggests AlTi Global Inc. is trading near its accounting equity base, which can sometimes act as a reference point for mean‑reversion traders.
The fundamentals underline that tug‑of‑war. Strong revenue but negative margins, negative free cash flow, and weak returns on equity and assets frame ALTI as a turnaround or restructuring type name, not a steady compounder. Yet the balance sheet shows sizable equity and manageable debt, giving the company some breathing room to work through its issues. That mix often produces choppy, news‑sensitive price action rather than a smooth trend.
For short‑term traders, the key is to treat the $3.00 level as a line in the sand and the $3.80–$4.00 area as overhead supply until proven otherwise. AlTi Global Inc. will likely offer tradeable swings around these zones, but only for those who respect risk and wait for clear signals in the tape. As I tell my students, “The edge is not in predicting where ALTI should trade, it is in waiting for the chart to show who is in control and then aligning your risk with that reality.” As Tim Bohen, lead trainer with StocksToTrade says, “I focus on what a stock is doing, not what I want it to do. Let the stock prove itself before you make a move.” This article is for educational and research purposes only.
This is stock news, not investment advice. StocksToTrade News delivers real-time stock market updates tailored to highlight the key catalysts driving short-term price movements. Our coverage is designed for active traders and investors who thrive in fast-moving markets, with a focus on volatile sectors like penny stocks, AI stocks, Robinhood stocks and other momentum plays. From earnings reports and FDA approvals to mergers, new contracts, and unusual trading volume, we break down the events that can spark significant price action.
Looking to level up your trading game? Explore StocksToTrade, the ultimate platform for traders. With powerful tools designed for swing and day trading, integrated news scanning, and even social media monitoring, StocksToTrade keeps you one step ahead.
Check out our quick startup guide for new traders!
- How to Read Stock Charts: A Guide for Beginners
- Trading Plan: 6 Steps to Create One
- How To Create a Stock Watchlist
Ready to build your watchlists? Check out these curated lists:
Once your watchlist is set, take the next step and trade with confidence using StocksToTrade’s robust platform. Don’t miss out — grab your 14-day trial for just $7 and experience the edge you need to thrive in today’s fast-paced markets.