

Alphabet Inc. stocks have been trading down by -11.05 percent amid heightened regulatory scrutiny and renewed antitrust concerns.
Key Takeaways
- Q3 EPS of $2.12 vs $3.02 consensus marked a sharp earnings miss for Alphabet and rattled confidence in near-term margins.
- Q3 Search & Other revenue of $63.4B and YouTube Ads revenue of $11.2B both came in below Street expectations, hinting at softer ad momentum.
- DOJ ad-tech remedies aimed at neutral auctions may reduce Google Ad Exchange’s win rate and push spend toward rivals like Magnite over time.
- A new EU corporate levy proposal targets large groups like Alphabet with over EUR 100M in regional revenue, adding tax overhang.
- A securities class action accuses Alphabet of misleading statements on growth and stability for traders who bought shares between 2026/05/19 and 2026/07/16.
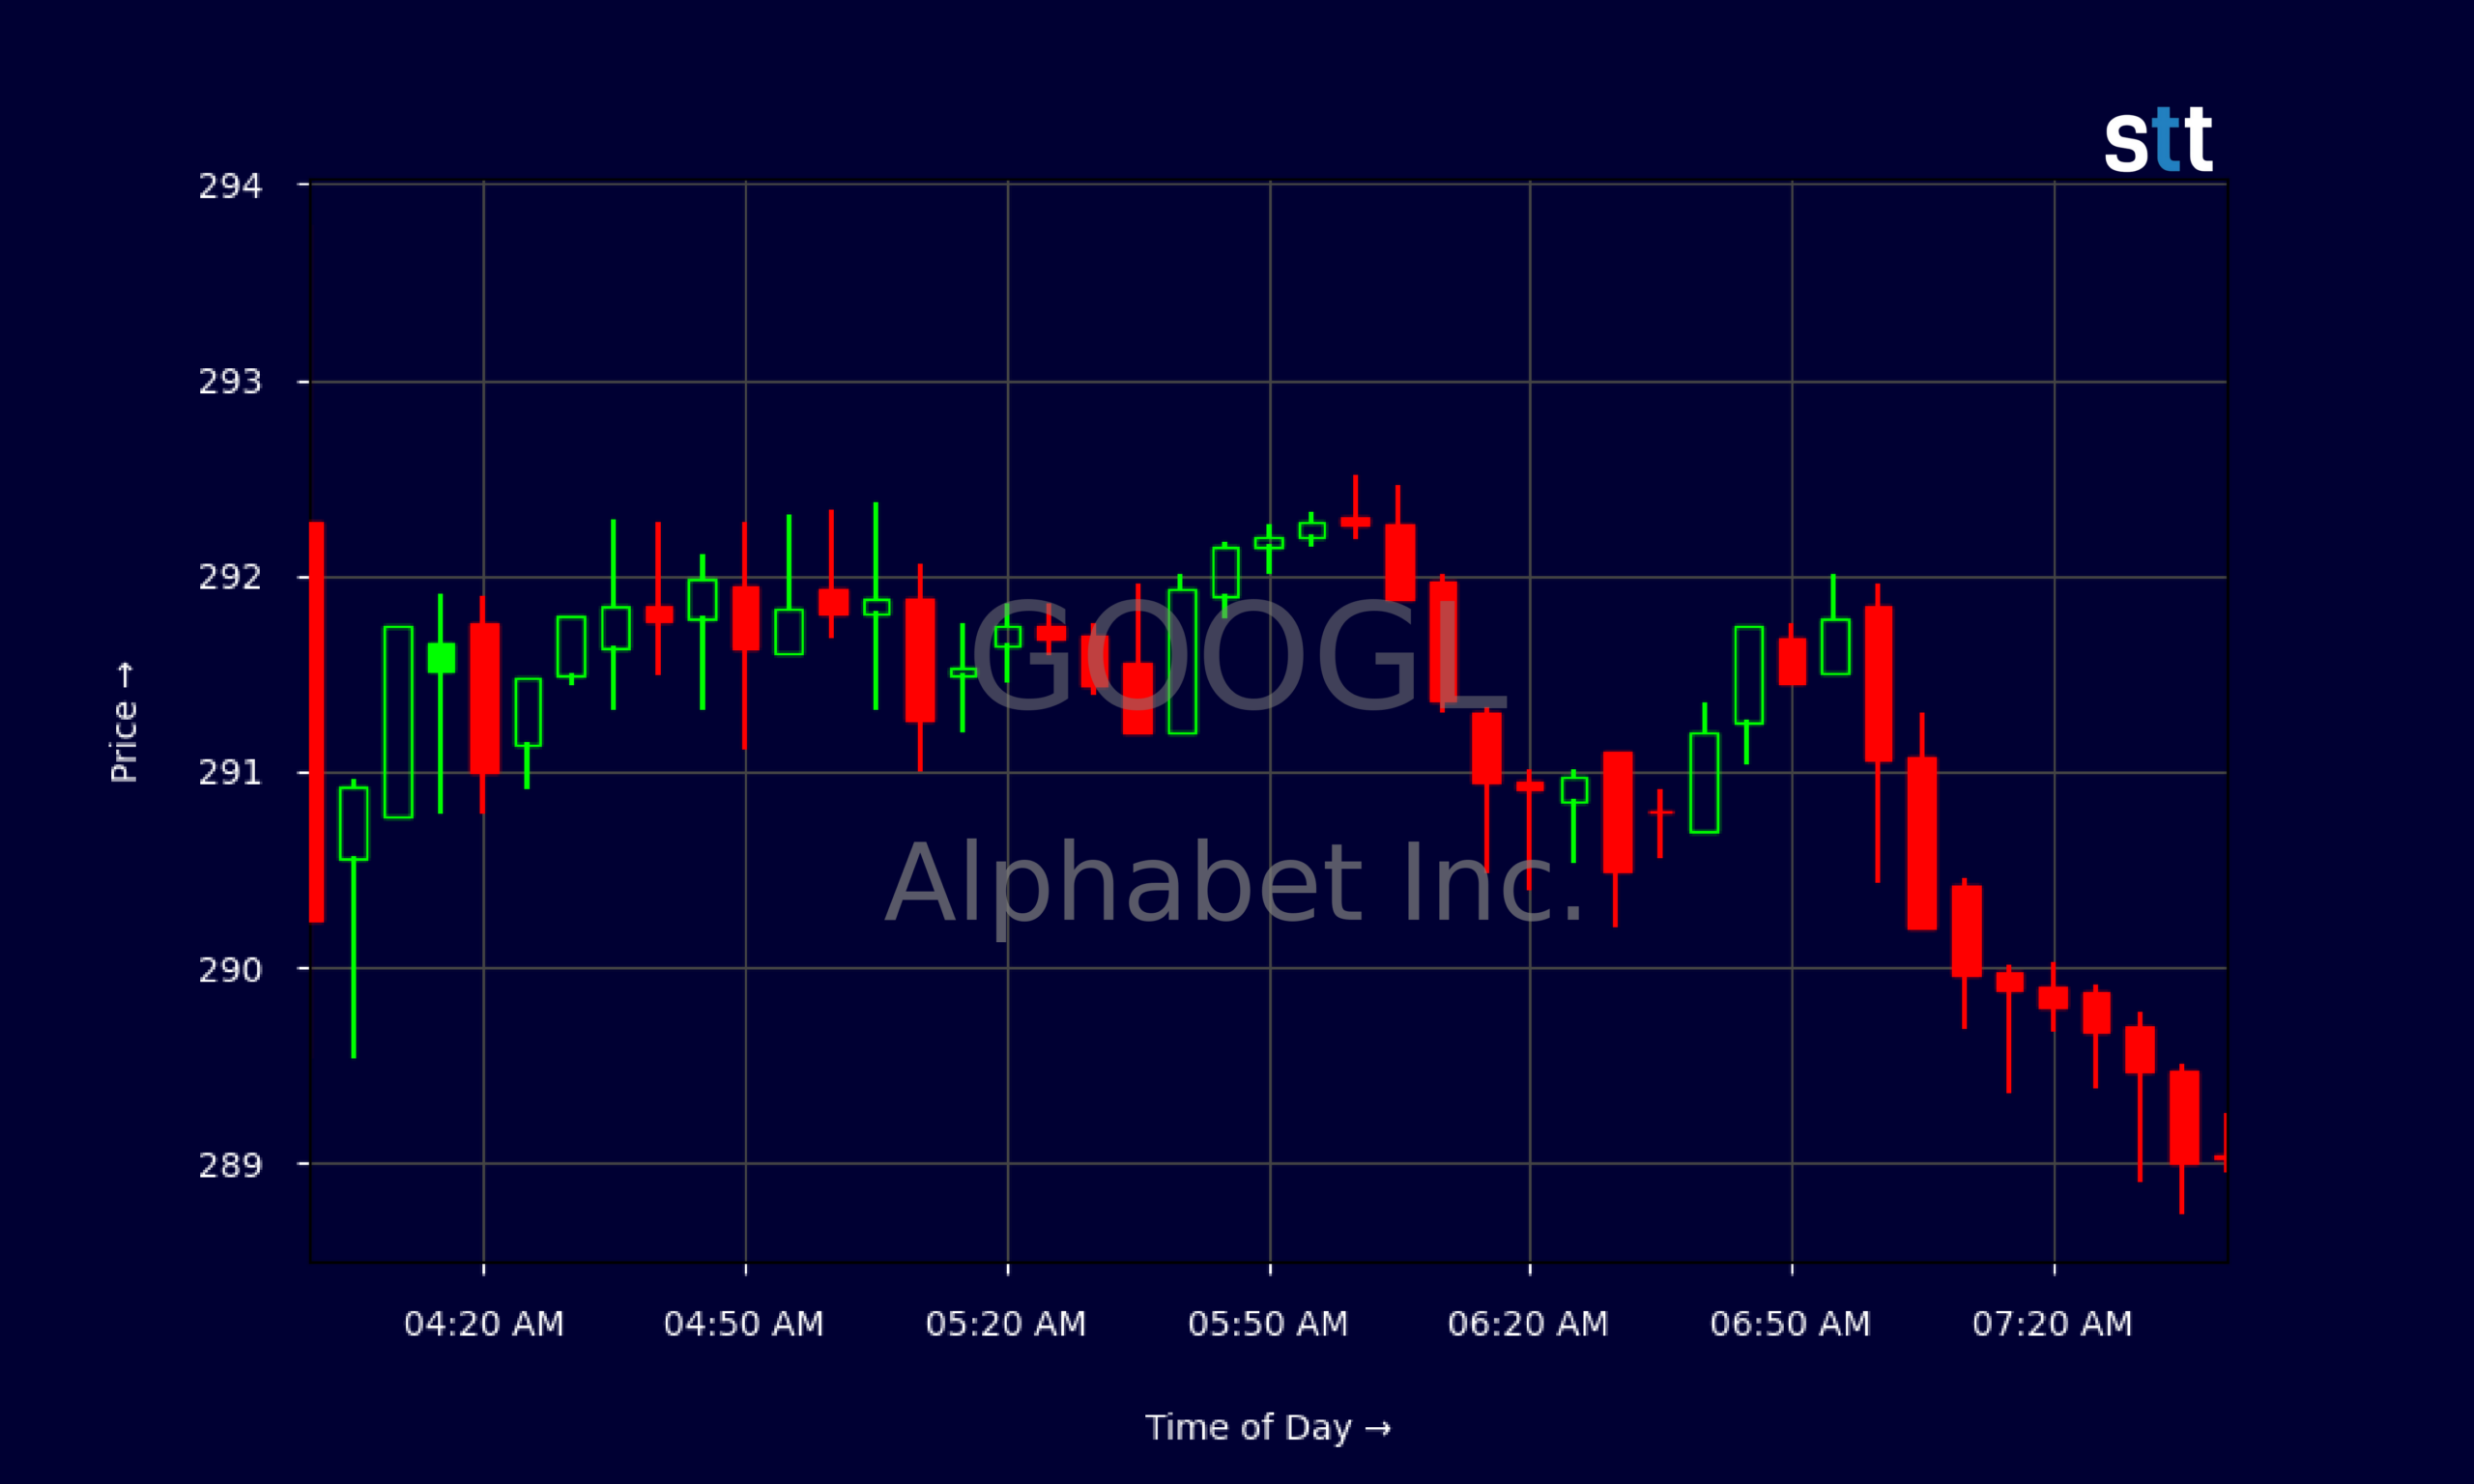
Live Update At 07:47:33 EDT: On Thursday, October 29, 2026 Alphabet Inc. stock [NASDAQ: GOOGL] is trending down by -11.05%! Discover the key drivers behind this movement as well as our expert analysis in the detailed breakdown below.
Quick Financial Overview
GOOGL just reminded traders that even mega-caps can wobble. Alphabet posted Q3 EPS of $2.12, well below the $3.02 FactSet consensus. That kind of gap usually tells you either costs are running hot, revenue is running cold, or both. Here, it’s a mix.
On the top line, GOOGL reported Q3 Search & Other revenue of $63.4B versus $65B expected, and YouTube Ads at $11.2B versus $11.4B. Those are still massive numbers, but this crowd trades the deltas. When a name priced as a compounder misses on its core ad engines, the market listens.
Zooming out, the longer-term ratios still paint Alphabet as a high-quality machine. Profit margin near 55%, EBIT margin above 55%, and return on equity around 32%–49% show GOOGL is not some broken story. Debt-to-equity at 0.18 and a current ratio of 2.7 give Alphabet a strong balance sheet, and a P/E near 17.7 is not crazy for this level of profitability.
But cash flow trends matter in this AI arms race. Free cash flow in the latest report swung negative at roughly -$5.9B as capex and AI build-out ramped. For traders, that shift is key: the chart now has to digest both an earnings miss and heavier spending.
More Breaking News
- EAT Stock Draws Aggressive Upgrades Ahead Of Earnings
- NCPL Stock Slides As Traders Weigh Weak Financial Profile
- INTR Stock Plunges As Brazil Fintech Selloff Deepens
- PURR Stock Pulls Back But Intraday Action Shows Fight
Price action reflects that tug-of-war. GOOGL’s daily chart shows a steady fade from the mid-$350s down toward the low-$320s, with recent closes clustering around $320–$325. That’s a clear downtrend off the highs, but not a collapse.
Why Traders Are Watching GOOGL Right Now
Alphabet and GOOGL sit in the middle of several fires at once, and that’s exactly what active traders look for. Start with the core problem: Q3 earnings disappointed on both profit and revenue. GOOGL’s EPS miss — $2.12 vs $3.02 — wasn’t a rounding error; it was a statement that the Street’s model for margins was too optimistic.
Then drill down. Search & Other at $63.4B and YouTube Ads at $11.2B both fell short of consensus. For years, traders treated Alphabet’s ad machine as the dependable cash cannon that funded everything else. When those core lines miss, the narrative shifts from “AI is funded by a bottomless ad river” to “maybe the river is slowing just as spending spikes.”
The spending backdrop matters. Truist now projects Microsoft’s big AI and cloud peers will run negative free cash flow as they pour money into infrastructure. Alphabet is already flashing that dynamic with negative free cash flow of about -$5.9B last quarter. Traders see the risk that Microsoft gets framed as the disciplined AI winner while GOOGL is lumped in with the cash burners.
Layer on structural hits. The DOJ ad-tech case is pushing toward “truly neutral” ad auctions. If that happens, Google Ad Exchange may win fewer auctions and lose share to names like Magnite. That’s not a one-quarter issue; it’s a multi-year margin overhang for GOOGL’s ad-tech stack.
Europe isn’t easing off either. The European Commission is working on a new corporate levy that would require large players like Alphabet, with more than EUR 100M of EU revenue, to pay an extra lump-sum tax. No hard numbers yet, but traders don’t need exact math to understand direction: more tax drag on high-margin earnings.
Finally, the securities class action accusing Alphabet of misleading statements about its growth and stability adds another headline risk. Legal overhangs rarely break a giant like GOOGL on their own, but they sour sentiment and can cap rallies when paired with weak earnings and regulatory heat.
Put it all together and GOOGL becomes fertile ground for short-term trading: negative news cluster, strong long-term fundamentals, and a chart that’s rolling over but still liquid and tight.
Conclusion
For active traders, GOOGL is no longer the clean “buy-the-dip and forget it” chart it used to be. Alphabet is now trading under the weight of a meaningful EPS miss, softer-than-expected Search and YouTube revenue, and a visible step-up in AI-driven capex that already pushed free cash flow negative. At the same time, DOJ ad-tech remedies, a potential EU levy, and a fresh class action suit all add layers of uncertainty the market has to discount.
That mix usually leads to what Tim Sykes and Tim Bohen talk about all the time — volatility plus clarity equals opportunity. As Sykes likes to say, “Volatility is only scary if you don’t know what you’re looking at; once you understand the catalysts, it becomes a road map.” As Tim Bohen, lead trainer with StocksToTrade says, “I focus on momentum that’s visible right now. Speculation on future moves is outside my playbook.” For GOOGL, those catalysts are clear: regulatory headlines, any update on the DOJ ad-tech case, progress of the EU corporate levy, and the next earnings print.
Traders on timothysykes.com and stockstotrade.com will be watching how GOOGL behaves around key technical levels after this string of bad news. Does support hold near recent lows in the $320 area, or does selling accelerate if another negative headline hits? The job now is to stay nimble, respect the trend, and remember the core rule of this community — cut losses fast and let the chart, not the story, guide your next GOOGL trade.
This is stock news, not investment advice. StocksToTrade News delivers real-time stock market updates tailored to highlight the key catalysts driving short-term price movements. Our coverage is designed for active traders and investors who thrive in fast-moving markets, with a focus on volatile sectors like penny stocks, AI stocks, Robinhood stocks and other momentum plays. From earnings reports and FDA approvals to mergers, new contracts, and unusual trading volume, we break down the events that can spark significant price action.
Looking to level up your trading game? Explore StocksToTrade, the ultimate platform for traders. With powerful tools designed for swing and day trading, integrated news scanning, and even social media monitoring, StocksToTrade keeps you one step ahead.
Check out our quick startup guide for new traders!
- How to Read Stock Charts: A Guide for Beginners
- Trading Plan: 6 Steps to Create One
- How To Create a Stock Watchlist
Ready to build your watchlists? Check out these curated lists:
Once your watchlist is set, take the next step and trade with confidence using StocksToTrade’s robust platform. Don’t miss out — grab your 14-day trial for just $7 and experience the edge you need to thrive in today’s fast-paced markets.