

ABM Industries Incorporated stocks have been trading up by 5.32 percent amid heightened optimism from its latest earnings-driven outlook
What Traders Need To Know
- Record Q2 2026 revenue of about $2.3B, up 8.4% with 6.1% organic growth, beat expectations and was driven by strength in Technical Solutions, Aviation, and Manufacturing & Distribution plus WGNSTAR and a solid backlog.
- Q2 adjusted EPS of $0.90 topped the $0.88 consensus, with modest profit improvement and solid cash generation from $66.2M in operating cash flow and $22.4M in free cash flow.
- Management reaffirmed FY26 adjusted EPS of $3.85–$4.15, modestly above the $3.96 consensus midpoint, and now sees organic and total revenue growth near the high end of prior ranges.
- Segment operating margin is guided to the low end of 7.8%–8.0%, with some margin compression, higher leverage at 3.2x after WGNSTAR, and flat Business & Industry growth tempering the upside story.
- The CEO pointed to sequential margin improvement, record first-half bookings of $1.2B, strong free cash flow, and expectations for higher second-half volume, better mix, and cost and pricing benefits to lift earnings and margins in 2H26.
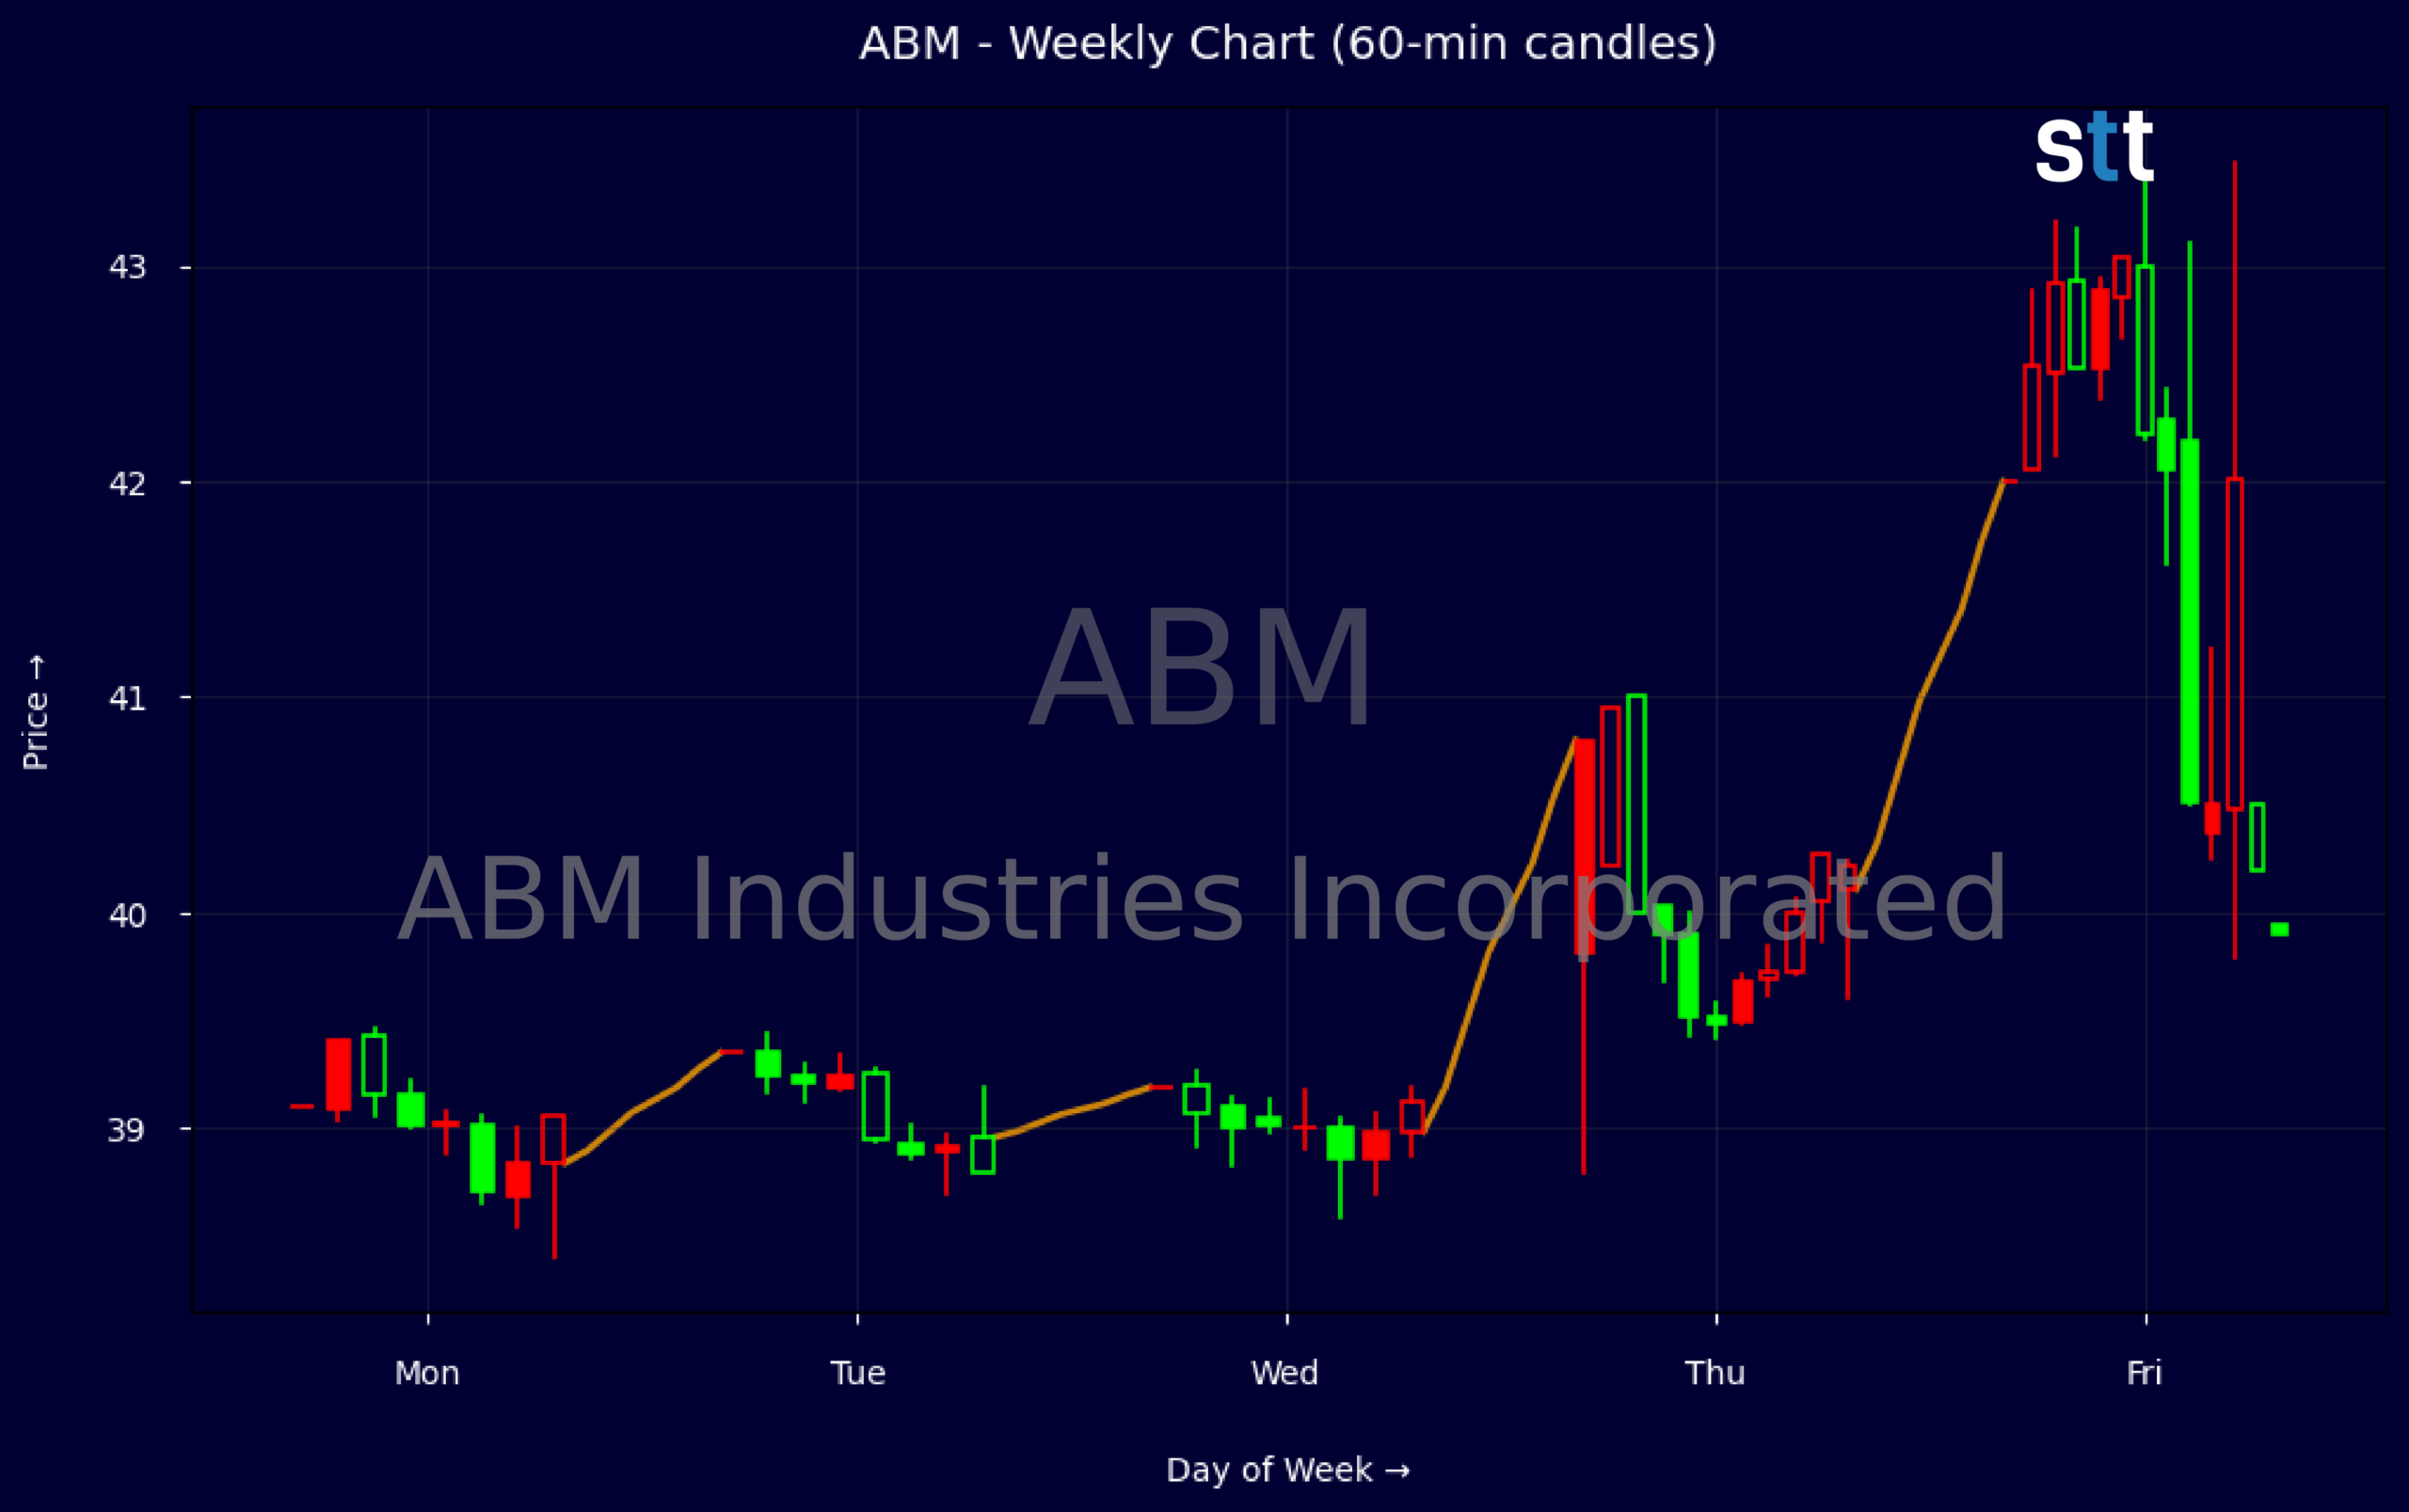
Weekly Update Jun 01 – Jun 05, 2026: On Sunday, June 07, 2026 ABM Industries Incorporated stock [NYSE: ABM] is trending up by 5.32%! Discover the key drivers behind this movement as well as our expert analysis in the detailed breakdown below.
Industrials industry expert:
Analyst sentiment – positive
ABM holds a solid but margin-constrained position in facilities and technical services, with $8.7B in revenue, modest 3–5 year CAGR, and thin 3.5% EBIT and 1.75% net margins typical for contract services. Returns on equity around 9% and ROIC near 7% are adequate but not exceptional, while leverage at 3.2x and 1.13x debt-to-equity reflect an acquisition-driven balance sheet. Valuation at ~15x EPS and 0.26x sales is undemanding, supported by a 2.7% dividend growing high single digits.
The weekly tape shows a decisive earnings breakout: consolidation around $39, an intraday spike to $41, then a clean push and close at $42 on rising volume, confirming a new short-term uptrend and clearing recent resistance in the high $39s. Dominant trend is now bullish above $40. Key actionable level: $40.00–40.50 as first support and attractive buy zone on low-volume pullbacks, with stop discipline just below $39. A break back under $39 would signal trend failure.
More Breaking News
- AAL Stock Slides As Fuel Shock Slams 2026 Outlook
- REGN Stock Jumps As Bullish Data And Targets Pile Up
- NOK Stock Slides As Earnings Strength Fails To Impress Traders
- Global Payments Stock Climbs As Analysts Hike Price Targets
Recent results beat on both revenue and EPS, with 6.1% organic growth, record $1.2B first-half bookings, and free cash flow of $22M, positioning ABM ahead of typical Industrials and Business Services peers on growth but slightly behind on margin. FY26 EPS guidance of $3.85–4.15 and high-end revenue outlook, despite higher leverage and some segment margin pressure, support a constructive stance. I see fair value at 11–12x forward EBITDA, implying a $46–48 share target, with support near $40 and resistance around $45.
Quick Financial Overview
ABM Industries Incorporated just printed a clean beat on both the top and bottom line. Q2 2026 revenue came in around $2.3B, up 8.4% year over year and ahead of roughly $2.21B expectations, with 6.1% organic growth doing most of the work. Adjusted EPS of $0.90 edged past the $0.88 consensus, confirming that ABM can still grow earnings despite cost pressure. For short-term traders, this kind of “beat and raise” dynamic often acts as a near-term upside catalyst.
The chart backs that up. Weekly data show ABM pushing from the low $39 area into the low $42s, with a spike week where price tagged $41 on the high before settling near $39.81, then driving to a $42 close. Intraday, the stock opened near $41.74 and ripped to about $43.39 before closing around $42.54, signaling strong post-earnings demand and active buying on the day. That kind of wide, green intraday candle usually reflects fresh money stepping in after the numbers.
Under the hood, ABM Industries looks like a low-multiple, steady cash generator. Trailing revenue is about $8.75B, with a price-to-sales ratio near 0.26 and a P/E around 15. Margins are thin but stable for a labor-heavy services name: gross margin near 12%, EBIT margin about 3.5%, and profit margin below 2%. Leverage is meaningful, with total debt-to-equity at 1.13 and a stated leverage ratio of 3.2, but coverage of 4.2 times interest and a current ratio of 1.5 give some cushion. The dividend yield sits around 2.7%, with mid‑single‑digit to high‑single‑digit dividend growth over three to five years, offering carry for swing traders willing to hold through earnings cycles.
Conclusion
This is stock news, not investment advice. StocksToTrade News delivers real-time stock market updates tailored to highlight the key catalysts driving short-term price movements. Our coverage is designed for active traders and investors who thrive in fast-moving markets, with a focus on volatile sectors like penny stocks, AI stocks, Robinhood stocks and other momentum plays. From earnings reports and FDA approvals to mergers, new contracts, and unusual trading volume, we break down the events that can spark significant price action.
Looking to level up your trading game? Explore StocksToTrade, the ultimate platform for traders. With powerful tools designed for swing and day trading, integrated news scanning, and even social media monitoring, StocksToTrade keeps you one step ahead.
Check out our quick startup guide for new traders!
- How to Read Stock Charts: A Guide for Beginners
- Trading Plan: 6 Steps to Create One
- How To Create a Stock Watchlist
Ready to build your watchlists? Check out these curated lists:
Once your watchlist is set, take the next step and trade with confidence using StocksToTrade’s robust platform. Don’t miss out — grab your 14-day trial for just $7 and experience the edge you need to thrive in today’s fast-paced markets.