
Momentum indicators are vital tools in technical analysis, helping traders gauge the speed and strength of price movements. By understanding momentum, traders can better predict potential reversals, continuations, and the overall health of the trend.
Read this article to add momentum indicators like RSI, MACD, and the Stochastic Oscillator to your trading toolkit!
I’ll answer the following questions:
- What is a momentum indicator in stock trading?
- How can momentum indicators reveal the strength of market trends?
- What are the key differences between various types of momentum indicators?
- How can traders use the Relative Strength Index and MACD effectively?
- What benefits do momentum indicators offer for identifying entry and exit points?
- How can the concept of divergence enhance trading decisions using momentum indicators?
- What are the limitations of using momentum indicators in volatile markets?
- How should traders adjust momentum indicator settings based on different market conditions?
Let’s get to the content!
Table of Contents
- 1 What Is a Momentum Indicator?
- 2 How to Use Momentum Indicators in Technical Analysis
- 3 List of Momentum Indicator Types
- 4 Benefits of Trading with Momentum Indicators
- 5 How to Trade with Momentum Indicators
- 6 Limitations of Momentum Indicators
- 7 Considerations When Trading Momentum Indicators
- 8 Key Takeaways
- 9 Frequently Asked Questions
- 9.1 What Is the Difference Between Momentum and ADX Indicator?
- 9.2 Are Momentum Indicators Profitable?
- 9.3 Which Is the Most Popular Momentum Indicator?
- 9.4 What Are Common Patterns Used in Momentum Trading?
- 9.5 How Can Investors Use Moving Averages to Spot Market Trends?
- 9.6 What Information Do Analysts Provide for Understanding Momentum Indicators?
What Is a Momentum Indicator?
A momentum indicator measures the rate at which the price of an asset changes. These tools are essential for traders looking to understand the velocity of price movements and to gauge the undercurrents of market trends. My extensive use of these indicators has reinforced their value in confirming trends and signaling potential reversals well before they become apparent through price movements alone.
How Does a Momentum Indicator Work?
Momentum indicators compare current closing prices to previous closing prices, providing a quantitative assessment of the speed and change of price movements. This approach helps in identifying whether the momentum is increasing or decreasing, which can be a precursor to a shift in market direction. Over the years, I’ve relied on these indicators to fine-tune entry and exit points, enhancing trade timing and effectiveness.
How to Use Momentum Indicators in Technical Analysis
Incorporating momentum indicators into technical analysis allows traders to cut through the noise of price fluctuations to view clearer market trends and potential turning points. These tools are indispensable for strategizing entries and exits, managing risk, and confirming other technical signals.
List of Momentum Indicator Types
Momentum indicators are diverse tools that each trader may employ differently depending on their specific strategy and market conditions. From the stochastic oscillator to the Relative Strength Index (RSI) and Moving Average Convergence Divergence (MACD), these tools are fundamental for identifying potential reversals, continuation patterns, and the strength of trends.
Through my teaching, I’ve shown how indicators like the Rate of Change (ROC) and Average Directional Movement Index (ADX) provide unique insights into market dynamics. For example, the ADX can help distinguish between trending and non-trending conditions, a distinction crucial for applying the right trading strategy.
Oscillators are a subset of momentum indicators crucial for detecting overbought or oversold conditions, a key concept in technical analysis. By measuring the speed and change of price movements, they help traders identify potential reversals before they happen. This is particularly useful in volatile markets where quick decisions are crucial.
Check out my comprehensive guide on oscillators in trading to learn how to use these very technical technical indicators.
Stochastic Oscillator
The Stochastic Oscillator is a popular momentum indicator used to determine overbought and oversold conditions. It compares a closing price to its price range over a given time period, with my strategies often using it to refine the timing of entries and exits during volatile market phases.

Relative Strength Index (RSI)
The Relative Strength Index (RSI) measures the magnitude of recent price changes to evaluate overbought or oversold conditions. It is a line graph that moves between two extremes and can be used to identify potential price reversals, failures, and the strength of price movements.

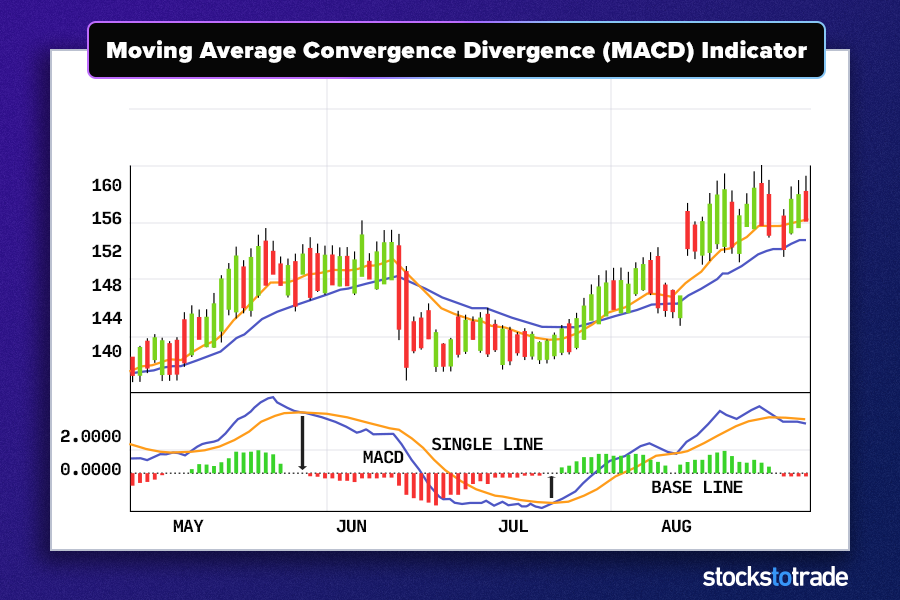
Moving Average Convergence Divergence (MACD)
MACD is used to reveal changes in the strength, direction, momentum, and duration of a trend in a stock’s price. I’ve found MACD invaluable for confirming trade signals in conjunction with other indicators, enhancing the robustness of my trading decisions.
Rate of Change (ROC)
The Rate of Change indicator measures the percentage change between the most recent price and the price a certain number of periods ago. It provides insights into the speed of price movements, helping to spot trend reversals before they occur.

Commodity Channel Index (CCI)
CCI helps identify new trends or warn of extreme conditions. I use this indicator to assess the level of a stock’s price relative to its average price level over a given period, aiding in spotting cyclical trends and potential price inflection points.

Average Directional Movement Index (ADX)
The ADX is used to measure the strength of a trend. High ADX values might indicate a strong trend, while low values can signal a weak trend. This indicator helps distinguish between trending and range-bound markets, guiding trading strategy accordingly.

On Balance Volume (OBV)
OBV uses volume flow to predict changes in stock price. The theory—price follows volume—has been a cornerstone of my approach, using OBV to confirm trends in price by observing trends in volume.

Benefits of Trading with Momentum Indicators
Trading with momentum indicators offers numerous advantages. These tools not only enhance the ability to spot trends but also help confirm the strength of buying or selling pressure.
In my experience, using indicators like the stochastic or RSI has consistently helped refine the timing of entries and exits, capturing trends at their most profitable points. The versatility of these indicators across various assets—from stocks to forex—and their ability to integrate with other technical tools like candlestick patterns and pivot points make them indispensable for both novice and experienced traders.
Momentum indicators are especially useful in trading strategies—identifying strong moves early on can lead to substantial gains. By aligning entry and exit points with momentum signals, traders can maximize their profitability while minimizing risks associated with trend reversals or pullbacks. To refine these strategies and enhance your trading performance, read more about momentum trading strategies here.
Trend Confirmation
Momentum indicators are crucial for confirming the presence of a trend and its potential sustainability. This confirmation helps traders avoid potentially faulty trades based on short-lived movements.
Overbought and Oversold Levels
These indicators provide clear signals that help identify when an asset is overbought or oversold, often indicating a potential reversal or correction. This has been especially useful in my trading to maximize gains and minimize risks.
Divergence Detection
Momentum indicators can also detect divergences where the price movement differs from the indicator direction, often signaling a potential price reversal. This advanced warning system has allowed me to adjust strategies before significant market moves.
Entry and Exit Points
Identifying optimal entry and exit points is perhaps the most direct application of momentum indicators. They can signal when the momentum is shifting, helping to time trades more effectively.
Risk Management
By providing insights into trend strength and potential reversals, momentum indicators aid in risk management, allowing traders to set tighter stop-loss orders and better manage their exposure.
Versatility
Momentum indicators can be applied across different markets and assets, making them versatile tools in a trader’s arsenal. Whether trading stocks, ETFs, or forex, these tools adapt to various environments and strategies, enhancing their utility.
How to Trade with Momentum Indicators
Trading with momentum indicators involves more than just recognizing bullish or bearish signals. It’s about understanding the relationship between price movements and momentum changes, which can be visualized through indicators like the MACD or stochastic lines.
Some trading strategies target crossovers of the signal line as a confirmation of trend changes, supplemented by patterns from candlestick charts such as doji or head and shoulders. This combination allows for a robust method to pinpoint entry and exit points, gauge market sentiment, and manage risks effectively.
Using the Volume Weighted Average Price (VWAP) indicator for confirmation can further refine entry and exit strategies. VWAP offers a cumulative indicator that provides valuable insights into both the trend direction and the levels of supply and demand, using price and volume data. This combination allows for a high degree of precision in measuring market sentiment during a trading day, particularly useful for short-term and intraday traders. For an in-depth understanding of how to use VWAP effectively alongside momentum indicators, check out my article on how to use VWAP.
Crossovers
Crossover strategies involve acting on the point where the momentum indicator crosses over a central line or another indicator. This method is particularly effective in catching early signals of trend changes, which can be critical for entry and exit decisions.
Concept of Divergence
Divergence occurs when the price trend and the momentum indicator trend move in opposite directions. It can be a powerful signal of an impending reversal. This concept has often guided my trades, providing a cautionary note when the market might be turning.
Limitations of Momentum Indicators
Despite their utility, momentum indicators have limitations. They are typically lagging, meaning they respond to price actions that have already occurred, which can delay decision-making. In markets characterized by high volatility, this lag can lead to missed opportunities or false signals.
In my webinars, I stress the importance of combining momentum indicators with volume-based indicators like On-Balance Volume (OBV) to mitigate these delays. Traders must be wary of over-reliance on any single indicator without sufficient confirmation from additional sources, as this can lead to misinterpretations, especially in sideways markets.
False Signals
While momentum indicators are powerful, they are not immune to false signals. These can lead to misguided trades if not corroborated by other analyses or indicators. My strategy always involves using a combination of indicators to filter out these potential inaccuracies.
Lagging Nature
Most momentum indicators are inherently lagging. They are constructed using historical data, which means they react to price changes that have already occurred. This can delay the signals, occasionally leading to missed opportunities.
Not Foolproof in Sideways Markets
In markets without a clear trend, momentum indicators can become less reliable. They are best used in markets with a clear uptrend or downtrend.
Over-Reliance
Over-reliance on any single type of indicator, including momentum indicators, can lead to a narrow view of market conditions. Diversifying analysis tools and maintaining a holistic view of market conditions remain crucial.
Complexity for Beginners
For newcomers, the complexity of momentum indicators can be daunting. It’s essential to gain a thorough understanding of each indicator’s mechanics and applications before incorporating them into trading strategies.
Overbought/Oversold Misinterpretations
Misinterpreting overbought or oversold signals can lead to premature or misguided trades. It’s crucial to understand these conditions in the context of the market’s overall momentum and other technical factors.
Divergence Limitations
Divergences can be strong indicators of potential reversals but relying solely on divergence without confirmation from additional signals can lead to false starts and potential losses.
Considerations When Trading Momentum Indicators
When deploying momentum indicators, several considerations should guide a trader’s strategy. The choice of indicator should align with the individual’s trading style and the specific security’s characteristics. For instance, Fibonacci retracements or pivot points may provide additional support and resistance levels that can enhance the effectiveness of momentum indicators.
Selecting the appropriate timeframe is crucial, as some indicators might perform better over shorter or longer periods. Integrating these tools into a broader trading strategy that considers market conditions and volatility can maximize their effectiveness.
Setting parameters correctly—tailored to current market conditions and the asset’s typical price movements—is essential for extracting the most value from these indicators.
Choice of Indicator
Selecting the right momentum indicator depends on the market, the asset being traded, and personal trading style. It’s important to experiment with different indicators to find the one that best suits your strategy.
Timeframe Selection
The effectiveness of a momentum indicator can vary significantly across different timeframes. It’s crucial to align the indicator with the intended trading timeframe to optimize its effectiveness.
Market Conditions
Momentum indicators perform best in markets with strong trends. Understanding the current market condition is vital to applying these tools effectively.
Confirmation Signals
Using additional signals for confirmation can help mitigate the risks associated with false or misleading signals from momentum indicators.
Setting Parameters
Adjusting the parameters of an indicator can greatly affect its performance. Tailoring these settings to the specific market and asset can enhance the indicator’s reliability and relevance.
Divergence Awareness
Being aware of and understanding divergences can provide advanced insights into potential market reversals, enhancing trading decisions.
Key Takeaways
- Momentum indicators are essential tools for analyzing market trends and making informed trading decisions.
- They offer benefits such as trend confirmation, risk management, and versatility across different assets and markets.
- However, traders must be aware of their limitations, including their potential to deliver false signals and their generally lagging nature.
There are a ton of ways to build day trading careers… But all of them start with the basics.
Before you even think about becoming profitable, you’ll need to build a solid foundation. That’s what I help my students do every day — scanning the market, outlining trading plans, and answering any questions that come up.
You can check out the NO-COST webinar here for a closer look at how profitable traders go about preparing for the trading day!
Are momentum indicators part of your trading toolkit? Write “I won’t trade without a plan” in the comments if you’re ready to trade the right way!
Frequently Asked Questions
What Is the Difference Between Momentum and ADX Indicator?
While both are used to assess the strength of market trends, some momentum indicators measure the speed of stock prices’ changes and overbought and oversold conditions, while the ADX quantifies trend strength without indicating direction.
Are Momentum Indicators Profitable?
Yes, when used correctly and in combination with other technical analysis tools, momentum indicators can help build a trading account by providing timely insights into market dynamics.
Which Is the Most Popular Momentum Indicator?
The most popular momentum indicators vary among traders, but names like the Relative Strength Index (RSI) and the Moving Average Convergence Divergence (MACD) are among the most famous due to their effectiveness in identifying trend strength and potential reversal points.
What Are Common Patterns Used in Momentum Trading?
Momentum traders often rely on technical patterns like the cup and handle, wedge, flag, triple top, and triple bottom to predict future market movements. These patterns help identify potential breakouts or reversals, providing traders with clues on when to enter or exit a trade. Analyzing these patterns alongside momentum indicators such as the average directional index (ADX) allows traders to gauge the strength of the trend.
How Can Investors Use Moving Averages to Spot Market Trends?
Investors use moving averages to smooth out stock price data over a specific period, helping them identify the direction of the market trend. By observing the relationship between short-term and long-term averages, investors can spot potential highs or points where the market is likely to rise. This method provides a clear visual representation of the market’s momentum and is crucial for deciding when to enter or exit a trade.
What Information Do Analysts Provide for Understanding Momentum Indicators?
Analysts provide critical information that helps investors understand and interpret momentum indicators. They often use a specific formula to calculate indicators like the average directional index, which measures the strength of a price trend. By offering examples and detailed analysis, analysts can help investors make more informed decisions based on the current market dynamics.