
Some days it feels like groundhog day…
I just keep reliving the same day over and over again.
And it’s not just because I’m a stickler for routine…
I wake up at the same time, work out, read the news, have the same breakfast, and then deliver quality education on my daily live webinars…
It’s because these penny stock patterns repeat.
And once you get past all the emotion and excitement of trying to make money, you can see them more clearly…
You can develop trust in the plans, stay calculated and execute…
Then the money can come.
Yesterday we had another repeating pattern play out. I talked about how to look for it recently in this newsletter…
But like these patterns and my daily routine — I too repeat myself.
See what you can learn from this pattern below so you can spot it and execute it the next time it comes around … Because it will…
Long Pattern #5
In my ebook, I give you 10 penny stock patterns every trader must know. Five are long patterns and five are short-selling patterns.
And yesterday my long pattern #5 played out…
I told you what to look for in this scenario a few weeks ago when KITT had its first green day.
The second-day pattern didn’t play out on that one. But when you don’t get the move, you don’t trade.
The plan keeps you safe.
But yesterday, Immunic, Inc. (NASDAQ: IMUX) did make the second-day move.
This is a textbook pattern…
When a stock has a big first green day with positive news and it closes near its highs, it’s almost always a watch for a weak open red-to-green move the next day.
What we look for after the big first-day run is for the stock to open weak. It opens red and that makes shorts think it’s the first red day…
Short sellers think they’re in control…
But the dip is brief and the stock reverses and goes green. That’s typically the level shorts use as their risk. And the buying starts there with shorts buying to cover and longs entering to ride the momentum…
For this pattern, enter when the stock goes green. Then use VWAP or the low of the dip as your risk.
From there you can use Oracle support and resistance lines to guide your trade.
Because even though the stock wasn’t on Oracle’s list, the support and resistance indicator is available for any stock, on any chart.
Look how accurately stocks can follow Oracle’s lines. The algo knows what it’s doing…
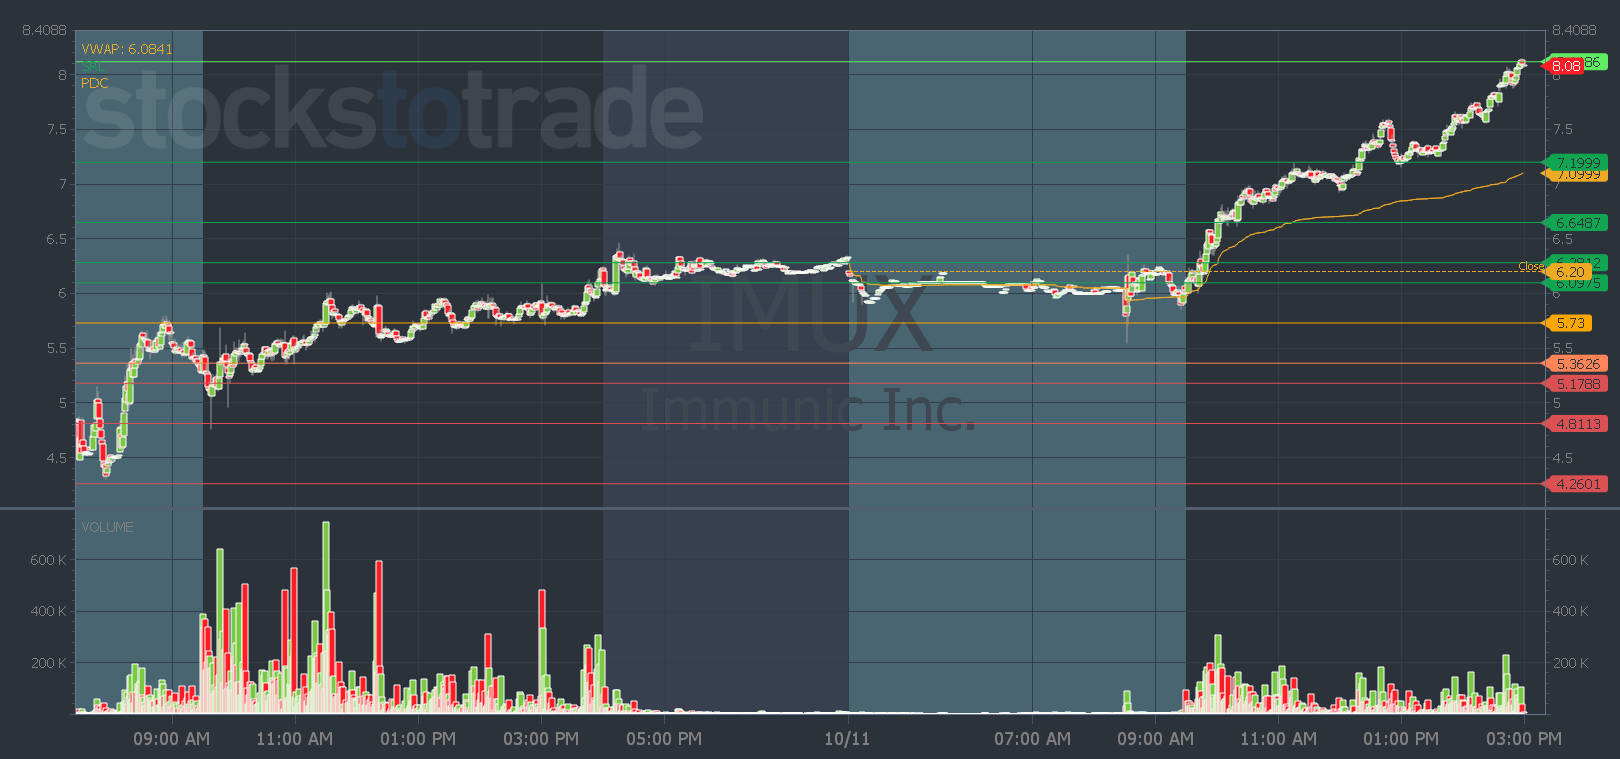
IMUX chart: 2-day, 1-minute candle — courtesy of StocksToTrade.com
The great thing about the red-to-green move is that you can trade any time after the first green day. It’s great for multi-day runners and even day trading ‘real’ stocks that are uptrending.
See all 10 of my patterns in my ebook. Or even better…
Get it for free when you join StocksToTrade Advisory.
Not only do you get my ebook and access to every Pre-Market Prep live webinar…
But you also get my special Tesla report, a weekly video watchlist, and every month I dive deep into a market sector or theme and deliver you three stocks to watch in my monthly report…
I’m dropping another one-time special report soon … Get it as soon as it lands by joining here.
Have a great day everyone. See you back here tomorrow.
Tim Bohen
Lead Trainer, StocksToTrade