
Lots of traders LOVE candlestick reversal patterns. That’s because they can help traders in the know spot a change in a stock’s direction before it happens.
They’re great tools to have in your trading toolbox.
In this post, I’ll talk about red and green candlesticks, bullish and bearish patterns, and how you can use candlestick reversal patterns in your trading.
Let’s take a look at the basics first…
Table of Contents
- 1 What Are Candlestick Reversal Patterns?
- 2 Why Should You Learn to Read Candlestick Patterns?
- 3 How Can You Use Candlestick Reversal Patterns?
- 4 What Is a Bearish Reversal Pattern?
- 5 9 Bearish Candlestick Reversal Patterns to Know
- 6 What Is a Bullish Reversal Candlestick Pattern?
- 7 Some Bullish Candlestick Reversal Patterns
- 8 Which Candlestick Reversal Pattern Is Most Reliable?
- 9 How Do You Find Price Trend Reversals?
- 10 Conclusion
What Are Candlestick Reversal Patterns?
It’s believed candlestick patterns date back to Japan in the 1700s when rice traders used them to chart the rice market. In this post, I’ll cover candlestick reversal patterns. But if you want to read more on candlestick patterns in general, check out this post.
A candlestick reversal pattern is a series of one to three candlesticks in a specific order. And when you learn to spot them on charts, they can signal a potential change in trend direction … This is when momentum begins to shift.
The shift can be either bullish or bearish.
Candle Graph Explained: How Does It Work?
I love looking at candlestick charts. I spend hours and hours studying charts, and I believe you should too. StocksToTrade makes charting reversals easy to study. It’s also great for scanning and finding other trading opportunities … Get your 14-day trial for just $7.
Candlestick charts provide a quick snapshot of a stock’s price action. You can pick any time frame to chart.
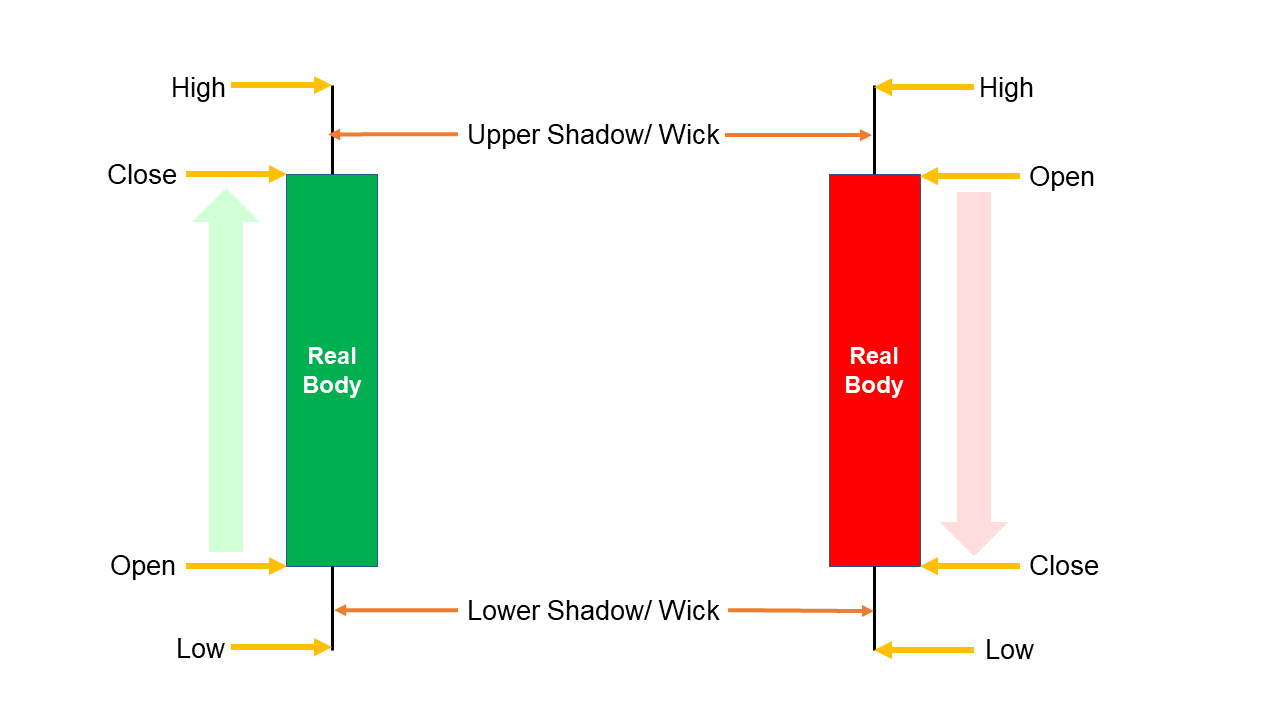
Here are the elements of a candle graph:
- Real Body: The total length of the candle
- Open: The opening price
- Close: The closing price
- High: The highest price the stock reached during the period
- Low: The lowest price the stock reached during the period
- Shadows (wicks): The thin lines at the top and bottom of the candle show the highest and lowest prices reached during the period
A green candle means the bulls are in charge. A red candle is a selling candle, with the bears in charge.
Remember, you can use candlestick charts to see a stock’s action over any time frame. The one you pick will depend on your trading plan and strategy.
In the image below, you’ll see how green and red candlesticks work.
 Why Should You Learn to Read Candlestick Patterns?
There’s no question that the more you prepare for something, the better off you’ll be.
By learning how to read candlestick patterns, you can spot patterns forming in real time.
Candlestick patterns are powerful because they help confirm trends. If you learn them, they can help you lower your risk and make informed decisions on how to trade.
Plus, a chart pattern can tell a good story. We talk about them a lot in the SteadyTrade Team community. If you’re just starting out, it helps to have a team that can help you understand the market and show you the ropes. With hands-on twice-daily mentorship, you can hone your own trading strategy for any kind of market. Sign up today if you’re serious about learning to trade!
How Can You Use Candlestick Reversal Patterns?
The markets are in a state of constant motion. You’ll see stocks moving up and down every second of the day.
You can use candlestick reversal patterns to help identify shifts in trend.
I always say you should wait for confirmation before placing a trade. Candlestick reversal patterns are no different.
It can be a good idea to watch how price action trades around moving averages, support, and resistance. Candlestick reversals will often start around these areas.
This is where good use of your technical analysis skills comes into play. Learn your candlesticks!
Reversal patterns can be either bullish patterns or bearish patterns. Let’s talk about the difference…
What Is a Bearish Reversal Pattern?
Bearish reversal patterns form at the end of an uptrend. They mean the stock may be about to reverse direction and turn downward.
A bearish candlestick pattern will show a closing price that’s lower than its open.
As bulls (buyers) become exhausted, selling pressure takes over and the trend reverses. It’s a good signal that price action may shift to the downside.
It’s also a good idea to keep track of what the trading volume is telling you. An increase in selling volume can help confirm a bearish reversal.
In the end, bearish reversals tell us a bullish trend may be over.
9 Bearish Candlestick Reversal Patterns to Know
Let’s cover some of the basic bearish reversal patterns.
Evening Star
The evening star is a pattern of three candlesticks. It forms around the top of an uptrend and signals that the trend may reverse.
The first is a large bullish (green) candle that’s part of an uptrend.
Then the second is a small-bodied candle that extends above the first and has two long wicks.
Finally, the third is a large red candle that closes around the middle of the first candle.
This candlestick pattern tells you that a bearish reversal is likely taking place.
Three Black Crows
The three black crows pattern consists of three red candles that trend downward like a set of stairs. It gives you a clue that an uptrend may be over.
It can be a powerful setup when a bullish upward trend becomes overextended.
The first candle is long-bodied and sets up the bearish reversal. The second candle is the same length and sets a new low. The third candle should be similar in size to the other candles and continues the trend lower.
In this pattern, all three candles have small or no wicks.
Bearish Engulfing Pattern
The bearish engulfing pattern is a two-candlestick reversal setup. This pattern often occurs around resistance levels.
The first candle is a bullish (green) candle that’s usually medium-sized. The second candle is a bearish (red) candle that engulfs the body of the first candle.
You’ll likely see a total reversal in momentum, with the second candle erasing gains.
Evening Doji Star
The evening doji star is a cousin of the evening star pattern. It’s a similar three-candlestick pattern.
The difference is that a doji candle forms in the place of the second candle.
A doji candle tells you that the stock opened and closed at about the same price. It’ll look like a plus sign on the chart.
I like to say dojis are candles of indecision between bulls and bears. It’s still the third candle of the pattern that confirms the bearish reversal pattern.
Shooting Star
A shooting star is a reversal pattern that forecasts falling price action. It’s a small body with a long upper wick.
A shooting star opens with a low price, then shoots up before closing near the open.
You’ll see a shooting star at the top of an uptrend. The long upper wick tells you the bulls tried to push the price up, but bears overpowered them and sent the price back down.
Dark Cloud Cover
The dark cloud cover is as ominous as it sounds. That’s because this pattern appears within an uptrend, which signals a reversal.
The dark cloud cover is a two-candlestick pattern.
The first candle is bullish, with a large body. The second candle is bearish and closes at almost the length of the first candle.
The drop should clear below 50% of the first candle, but not totally engulf it … That would turn it into a bearish engulfing pattern.
Bearish Harami
A bearish harami is a pretty simple pattern to recognize. If you look closely, this pattern resembles a pregnant woman. (Harami is Japanese for pregnant.)
The bearish harami is another two-candlestick pattern that appears during an uptrend.
The first candle is a long-bodied one. With the second, there’s a small, bearish candle that forms around the middle of the first.
You’ll need to use caution with this pattern. Since the bearish second candle is smaller, the bears may not have total control.
Bearish Harami Cross
A bearish harami cross is similar to the bearish harami pattern.
The difference is that a second “baby” candle forms as a doji. And the doji candle is still contained within the range of the first candle’s body.
Remember, a doji candle signals indecision. You should be aware that bulls may try to push price action higher.
Hanging Man
This name makes me think of old Western movies.
You’ll find the hanging man at the peak of an uptrend, signaling a potential reversal.
A hanging man is a one-candlestick pattern. The real body of a hanging man candle is short, with a long lower wick and no upper wick.
The hanging man starts with a significant sell-off from the candle’s open. Then the buyers (bulls) come in and bid the price up close to the candle’s opening.
It indicates that buyers have lost strength and the bears have outnumbered them.
OK, enough about the bears … Let’s talk about the bulls.
What Is a Bullish Reversal Candlestick Pattern?
The bullish reversal identifies a possible end to a bearish trend. It also indicates where buyers were able to overcome selling pressure.
These patterns are shifts in bullish sentiment to predict a possible uptrend in price movement.
A bullish pattern features consecutive green candles and higher closing prices.
Some Bullish Candlestick Reversal Patterns
Let’s cover some of the basic bullish reversal patterns.
Piercing Line
The piercing line is a two-candlestick pattern. It marks a potential downward trend reversal.
It’ll often form during a downtrend and sometimes around support levels.
The first candle is a bearish (red) candle that continues a downward trend. The second candle opens lower, but bulls (buyers) were able to rally and retrace at least 50% of the first candle.
It’s important to note this 50% retracement. If it goes any further, you’ll have a bullish engulfing candle set-up.
A piercing line indicates that the bulls are stepping up and bears are losing control.
Morning Star
The morning star can be a beacon of light to bullish traders.
It’s a bullish reversal pattern that’s made up of three candlesticks. This pattern tends to form during a bearish downtrend.
The first candle is a long-bodied red candlestick. And the second is a smaller-bodied candle that can be either green or red.
The second candle is small with a small wick or none at all — it looks like a morning star. This can indicate selling pressure is wavering.
The third candle’s real body is bullish and medium in length.
Remember … always wait for confirmation by looking for volume.

Morning Doji Star
The morning doji star is similar to the morning star. It’s also a three-candlestick pattern that signals a possible reversal…
The difference is that the second candle is a doji. Like the morning star, the third candle with volume confirms the reversal.
Bullish Harami
The bullish harami is a mirror opposite of the bearish harami. It’s also a two-candlestick pattern that signals a possible reversal.
A bullish harami tends to form at the end of an established downtrend.
The first candle is a long-bodied bearish (red) candle. The second is a smaller, green candle that fits inside the range of the first candle.
This candlestick pattern also resembles a pregnant woman.
A bullish harami pattern can be a good sign of bullish momentum.
Bullish Harami Cross
A bullish harami cross looks a lot like a bullish harami pattern. The difference is that the second “baby” candle forms as a doji. And the doji candle forms within the middle half of the first candle’s body.
Be aware that sellers may try to push price action lower!
Bullish Engulfing Pattern
The bullish engulfing is a bullish reversal made up of two candlesticks. It usually occurs near the bottom of a downtrend.
The first is a short-bodied bearish (red) candle that continues the downtrend. When the second forms, it’s a long-bodied bullish (green) candle that completely covers the first.
This one’s a powerful bullish candlestick pattern in trading. Bears have clearly overstayed their welcome, and the bulls have taken control of the price action.
Inverted Hammer
The inverted hammer identifies the potential bottoms of downward trends. It’s a single candlestick pattern that signals a bullish reversal is possible.
This pattern appears like an upside-down hammer. It’ll have opening and closing prices that form a small real body. And there will be a long shadow that extends twice the length of the body.
The long upper shadow suggests buyers were willing to bid the price higher, but bears were able to push it back down.
So with this pattern, you can expect to see buying pressure continue.
Hammer
A hammer is another one-candlestick pattern. It’s a type of bullish reversal that forms during a continued downtrend.
The candle resembles a hammer, with a short real body and a long lower wick that’s at least twice as long as the body.
The lower shadow means the bears had control during the trading period, then the bulls managed to bid the price back up. The candle ends the trading period close to the opening price.
It’s important that you wait for confirmation that the trend has reversed upward.
Three White Soldiers
This pattern forms as three consecutive green candles. It’s a pattern that forms at the bottom of a downtrend.
These three candles feature long, bullish bodies similar in length. The three white soldiers each open at the previous close.
The three white soldiers is one of the strongest bullish reversal patterns.
Which Candlestick Reversal Pattern Is Most Reliable?
I can’t answer that question. Success in trading boils down to having the discipline to follow your rules.
That said, a lot of traders consider the harami, engulfing, and piercing candles to be reliable reversal patterns. Before taking any trade, you need to know your plan, have a strategy, and a set stop-loss.
If you want some company while you’re learning these things, consider joining the SteadyTrade Team. With hands-on, twice-daily mentorship, you can hone your own trading strategy for any kind of market. Sign up today!
How Do You Find Price Trend Reversals?
This is a question I get asked a lot. The short answer is that you can’t really scan for patterns.
In the markets, volatility changes fast, and patterns may not play out the way you might expect them to.
One smart way to find trend reversals is to use scanners, like the ones built into StocksToTrade. Check out the two-week trial with the game-changing Breaking News Chat add-on for $17.
And listen to our SteadyTrade podcast to hear what traders think about all this.
Conclusion
Every candlestick pattern contains a wealth of information.
The best way to read candlestick reversal patterns is to practice, practice, practice…
StocksToTrade is designed to give you the best tools for doing that. It’ll help you do your research, create watchlists, and see real-time quotes.

See how StockstoTrade can help you on your trading journey. Get your 14-day trial for $7, or combine it with the Breaking News Chat add-on for $17.
What candlestick reversal patterns would you like to trade? How do you see reversal patterns helping with your trading? Leave some comments below and let us know!