
Learning how to read earnings reports is a great way to see whether they’ll move a stock.
Because when the news is good, there’s nothing that moves a stock like earnings!
On the SteadyTrade Team, we love trading earnings winners. But earnings can be confusing for new traders…
Especially when a stock starts trending down after a ‘good’ earnings report.
Just because a company has good earnings doesn’t mean it has good financials. Often it’s a ‘buy the rumor, sell the news’ type situation.
It’s easy to start believing in a stock when you think you have proof. This is why understanding earnings reports is crucial. They can be among the best catalysts for a stock.
But if you read them wrong, you could be in for a nasty surprise.
Table of Contents
- 1 How to Read Earnings Reports: What Is an Earnings Report?
- 2 How to Read Earnings Reports: Why Does It Matter for Traders?
- 3 What Should I Look for in an Earnings Report?
- 4 How to Read Earnings Reports
- 5 How to Identify Financial Risk Factors on Earnings Reports
- 6 How to Find Earnings Reports
- 7 When Do Companies Report Earnings?
- 8 How Often Are Earnings Reported?
- 9 Earnings Reports and Quarterly Reports: What’s the Difference?
- 10 What Does an Earnings Report Look Like?
- 11 Frequently Asked Question About Reading Earnings Reports
- 12 How to Read Earnings Reports: Conclusion
How to Read Earnings Reports: What Is an Earnings Report?
What is a quarterly earnings report? It’s where a company tells the public how much money it’s bringing in … which is a big part of what its shares are worth.
If you value fundamental analysis, you need to know how to read earnings reports. They’re a great source of unbiased information on a company’s financial health. And they can trigger a stock run.
Some of the basic metrics that determine a company’s value are tied to earnings.
The most basic is earnings per share (EPS). This is a formula that takes the company’s earnings and divides them by the number of its shares.
This ratio shows a company’s profitability on a per-share basis. It helps give a better picture of the company’s financials over the years. EPS is really useful when the company dilutes its shares.
EPS also helps you calculate a stock’s price-to-earnings (P/E) ratio. This is another essential metric. Popular wisdom says it’s a good indicator of whether a stock is overvalued or undervalued.
You get the P/E ratio by dividing share price over EPS. But you don’t need to look into this too hard.
What’s a good EPS and P/E ratio? There’s no one answer.
A young company may have a very high or negative valuation. But that could be because they have yet to become profitable.
Even an established company like Tesla can have a sky-high P/E ratio. That’s because the market thinks it will be much more profitable in the future.
At the end of the day, that’s all any of this information is good for — to help you figure out what the market thinks.
What About a 10-Q?
The earnings press release is what companies want to put out there. The 10-Q has the facts, warts and all.
10-Qs are documents legally required by the SEC every quarter. They give you the company’s information in a straightforward manner. There’s a formula they follow — which can come in at more than 100 pages!
It contains the company’s income statement, balance sheet, and cash flow.
10-Ks are the annual version. They add sections on the company’s business structure and its long-term financial history.
Companies summarize these details in their earnings press releases. Be warned — they do their best to make all the news seem good.
The 10-Q and 10-K are better sources of earnings facts. They have a strictly regulated format, and can’t be massaged to highlight the positives.
How to Read Earnings Reports: Why Does It Matter for Traders?
All right, now we’re getting to the good stuff. Why should you care about earnings reports?
Let’s cut to the chase: The market loves them. When earnings are good, they’re one of the biggest catalysts that move stocks.
They can also be tricky. When we talk about an earnings winner, we mean earnings news that the market responds well to.
We don’t try to predict the market. We stay aware of upcoming catalysts and what they might do … Then we react when they do it.
That’s the thing about earnings. With bigger stocks, the move will often already be priced in. It’s when the market is surprised by the earnings report that earnings winners are made.
It’s smart to be part of a community like the SteadyTrade Team, where we talk about this stuff all the time.
We get to know these stocks as well as the overall market mood. We look at trends. I answer a ton of questions every day. If you show up every day, you can learn so much about your strategy and market approach.
Learn more and sign up for our incredibly collaborative SteadyTrade Team now!
What Should I Look for in an Earnings Report?
There’s a lot of news throughout the year. A good catalyst gives a sign of a company’s future prospects…
This could be a new phase for a drug trial, or a deal to make batteries for Tesla. Catalysts can even move an entire sector when they’re big enough.
Everyone’s looking for an edge in knowing a stock’s value…
But the only real confirmation traders get comes four times a year…
And it’s in those quarterly earnings reports. When they surprise the market, they can push demand high or low.
Is the stock trending up before earnings? The market might expect it to fall. Is it trending down before earnings? It could gain on just decent results.
Sometimes these predictions turn outright. But that isn’t how we look to trade earnings on the SteadyTrade Team. We wait to see what happens.
And we pay close attention to the following signs…
Earnings Winner
We love to trade an earnings winner. But what is that?
Companies reporting earnings will sometimes lose money — and then their shares will spike. If a company’s lost less money than the market predicted, this can make it an earnings winner.
Sometimes a company will make money and its stock will still fall after earnings.
We NEVER hold a stock into earnings on the SteadyTrade Team. Once the earnings report comes out, it’s the moment of truth.
Rocket Cos. Inc. (NYSE: RKT) was one of our favorites after its earnings came out on February 25.
The market reacted positively to the report on March 1. On the market close session of the SteadyTrade Team, we talked about holding the stock overnight.*
It was a WallStreetBets favorite too, and they once again crushed the shorts. It went from $24 at market close March 1 to $44 at market close March 2.
It fell to earth overnight … Now it’s holding at a notch above where it was before earnings.
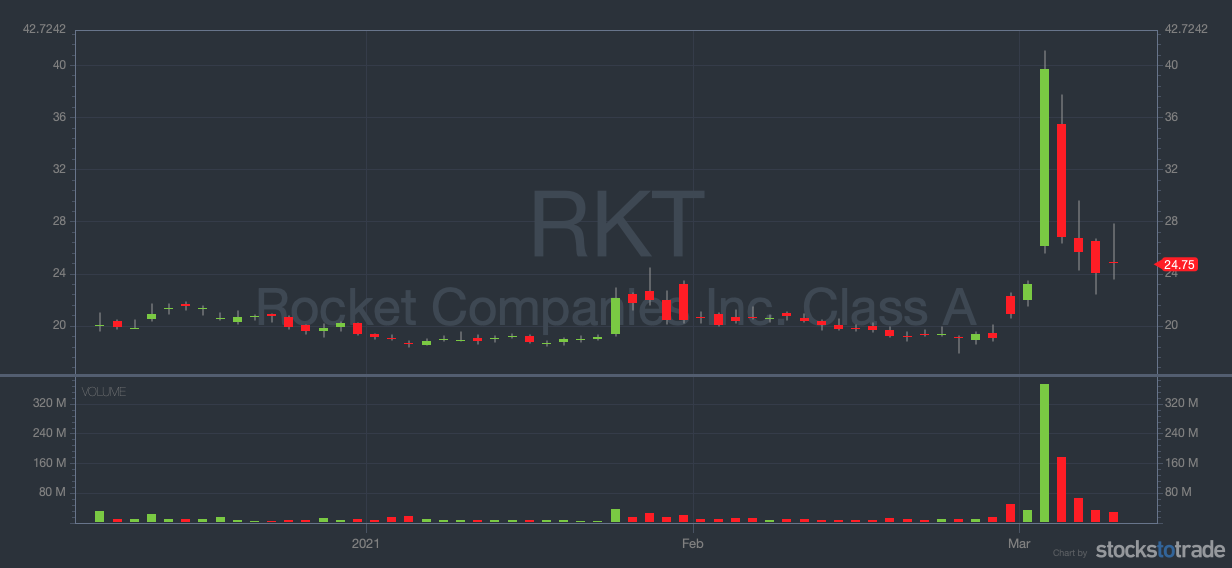
Rocket Companies Inc (NYSE: RKT) three-month chart (Source: StocksToTrade)
It’s a good example of an earnings winner and a good example of why you shouldn’t hold an earnings winner too long.
(*Note: Past performance is not indicative of future results.)
Volume
I want to see a lot of volume coming into an earnings winner. This is one of your best indicators that the market is excited about a stock.
If the volume rises as high as it did with RKT, it can create some good float rotation. And that makes for more demand — which pushes the price up.
RKT has a float of 100 million shares, which isn’t considered low float. But on March 2, its volume spiked to more than 10 times its daily average. When you add in short interest close to 40%, that’s a good recipe for a short squeeze.
Percent Gainer
It’s got to be up big for me to even consider trading it.
I usually set my screener to pick up on earnings winners up more than 5% in pre-market. If they hit 52-week or all-time highs, that’s even better.
How to Read Earnings Reports
How do you read an earnings report?
It helps to break it down. There are a few key sections in 10-Qs and 10-Ks that we can look at to give an accurate picture of how a company is doing.
This isn’t exactly what I call light reading. But you don’t have to be an expert to get some valuable insight from an earnings report.
10-Qs compare quarterly earnings with the same quarter a year before.
10-Ks give you even more perspective. But they may be out of date by the time they’re available.
Here’s what’s in an earnings report…
Financial Statements
This is the main thing we’re looking for. These financial statements are all audited. They’re more trustworthy than press releases.
They include an income statement, balance sheet, and statement of cash flow.
The income statement covers the company’s quarterly or yearly earnings.
The balance sheet gives you a fuller picture of the company’s equity. It lists assets, shareholder equity, and any outstanding debts.
The cash flow statement catalogs gross income and business costs. It covers all cash going in and coming out of the company.
Management’s Discussion and Analysis of Financial Condition and Results of Operations
This is also known as MD&A. It’s a chance for the executives to provide a little context
They’ll use this space to describe what went on in the period that the report covers. They may also explain the company’s future direction. MD&A can include discussion of changes at the company, new products, and business goals.
The information in this section can help traders understand the trends the company’s following.
Quantitative and Qualitative Disclosures About Market Risk
This is the place where a company must reveal any threats to its health.
These threats can be from the company’s cash flow or market conditions.
Controls and Procedures
Here’s where the company talks about how it maintains accuracy for its earnings statements. This isn’t a guarantee that the earnings are accurate, though.
Legal Proceedings
Is the company involved in any lawsuits? If so, here’s where they’d be listed.
A lawsuit isn’t a problem on its own. But if it generates publicity, it could cause the stock’s price to drop.
Risk Factors
In this section about risk, the company is supposed to reveal any potential problems. These risks might come from expansion, a change in company structure, or something else.
Business
This section is part of the 10-K. In it, the company gives a rundown of its main products and services.
Selected Financial Data
This part is also unique to the 10-K. It gives an overview of the company’s finances over the past five years. For the 10-K, the basic financial statements are also expanded up to the past three years.
How to Identify Financial Risk Factors on Earnings Reports
Which risk factors are actual risks to traders?
The SEC tries to get companies to provide an accurate view of their businesses. But as with everything in the market, there are no guarantees.
It’s best not to believe in any stocks you trade. React to what the market shows you, and you’ll see what a stock is actually worth.

How to Find Earnings Reports
This stuff is a matter of public record. You can look up earnings report dates for any stock on your watchlist.
But if you want to see earnings reports for the whole market, you’ll need a good stock screener. The one I use is StocksToTrade.
This powerful software has everything I need to find earnings winners. It also has:
- Awesome charting capabilities, so I can see when an earnings winner fits one of my setups
- A robust news scanner that pulls in SEC filings, tweets, and news stories to the same place
- A suite of built-in stock screeners, designed by experienced traders
Try it for the next 14 days for only $7!
When Do Companies Report Earnings?
Each earnings season starts one or two weeks after the last month of each quarter. Companies stagger their earnings reports over the period.
Earnings season makes it easier for traders who can’t trade every day. Especially those with full-time jobs or other commitments. Many part-time traders get a bit more active during earnings season.
StocksToTrade’s Breaking News Chat can help simplify things even more.
We’ve got two longtime Wall Street pros scanning the news and picking out the catalysts that can really move stocks. And they know how to read earnings reports.
When you subscribe to the Breaking News Chat, you’ll get alerts on these hot news nuggets every trading day. Our moderators use their years of experience to separate the wheat from the chaff. They only deliver the news that has real potential to move stocks.
It’s available as an add-on with your StocksToTrade subscription. Don’t have StocksToTrade yet? Get a 14-day trial of STT + Breaking News Chat for just $17 today.
How Often Are Earnings Reported?
Earnings season kicks off each January, April, July, and October. It lasts about four to six weeks.
That adds up to roughly 24 weeks per year for potential trades — almost half the year.
Companies must file earnings no more than 45 days after the end of each of the first three quarters. The annual earnings report is due 90 days after the end of the fiscal year.
Earnings Reports and Quarterly Reports: What’s the Difference?
The term ‘earnings report’ can refer to the company press release that accompanies a 10-Q or 10-K. These press releases are the numbers the company wants to show off. The 10-Q and 10-K are the SEC-standardized facts.
What Does an Earnings Report Look Like?
These days? They’re long, long PDFs.
Frequently Asked Question About Reading Earnings Reports
What Are Stock Market Earnings Reports?
In the stock market, earnings reports are a deep dive into a company’s business structure and finances. And they’re also one of the most predictable catalysts to trade.
What Should I Look for in a Quarterly Report?
The best way to prepare yourself to trade an earnings winner is to figure out what the market’s looking for. Is the stock already trending up? Earnings had better be high enough to justify the enthusiasm.
Should I Trade a Stock Before or After an Earnings Report?
Traders who try to predict the market have uneven track records. I always tell my students to wait until an earnings report is released before trading it. Then you can see how the market responds.
How to Read Earnings Reports: Conclusion
Knowing how to read earnings reports will help you decode one of the biggest catalysts in the market.
Just remember, it’s not what’s in these reports that matters. It’s how the market responds to them.
A good trading community like the SteadyTrade Team can help make sense of what the market’s doing.

You never want to get caught on the wrong side of earnings momentum. And when you find confirmation on an earnings winner, it can be a powerful thing.
How do you trade in earnings season? Do you think this market has been good for earnings winners? Let me know in the comments — I love hearing from my readers!