
What is a Dead Cat Bounce
Sushi rolls, five bar patterns, and the dead cat bounce are trend reversal patterns that alert the trader to a possible change in the current trend.
A Dead Cat Bounce is a technical trading pattern that’s unique to stock, forex, and commodities bear markets whereby a swift drop is followed by a small, short-lived recovery before another brutal drop takes over.
This Pattern is largely considered an indicator of continuing market weakness.
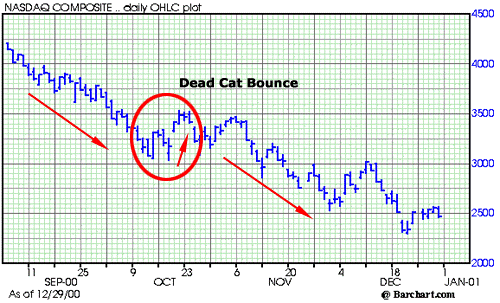
Table of Contents
So, what causes A Dead Count Bounce in the first place?
Market sentiment, for one. For instance, take a stock that has finished lower for six weeks in a row.
At this juncture, even the most ardent bears are likely to be clearing their short positions in a bid to lock in profits.
Meanwhile, value investors might now find the stock attractively valued and start building new positions while momentum traders see oversold signals beckoning on their charts and prepare to go long.
A confluence of these factors is likely to result in significant buying pressure, albeit only briefly.
Download a PDF version of this post as PDF.
In the chart above, the Nasdaq posted several quick gains of approximately 7.8% after a long string of losses.
This happened right in the throes of the dotcom crash when the tech-heavy Nasdaq Composite was hammered very badly.
The gains were, however, only short-lived, and the Nasdaq would go on to lose a staggering 78% of its value from March 11, 2000, through October 9, 2002.
What if It’s Just a Market Reversal?
A trader can use the dead cat bounce to initiate a short or sell position. In reality, though, spotting the dead cat bounce can be tricky business because the beginning of an upturn could be a sign of a complete trend reversal.
In the Nasdaq chart above, a complete reversal eventually arrived when the overall market sentiment turned bullish despite an apparent dead cat bounce pattern appearing at the bottom.
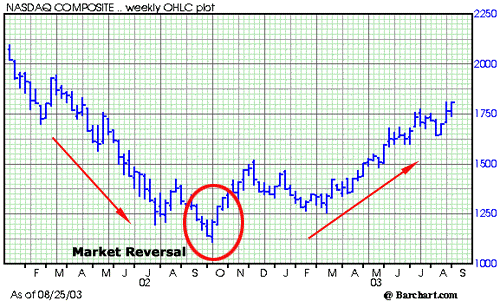
The Dead Cat Bounce is not confirmed when the price takes a turn higher during a downtrend, but rather when the price breaks below the previous bottom.
To do this on a Fisher Price level:
- Pick a stock that is going through a strong bear trend. The timeframe of the bear trend could be minutes, hours, days, weeks, etc.
- Identify an upturn in the price that breaks the downtrend. The bounce should be relatively minor compared to the retracement of the down move from the recent high.
- Wait until the price breaks below the previous low.
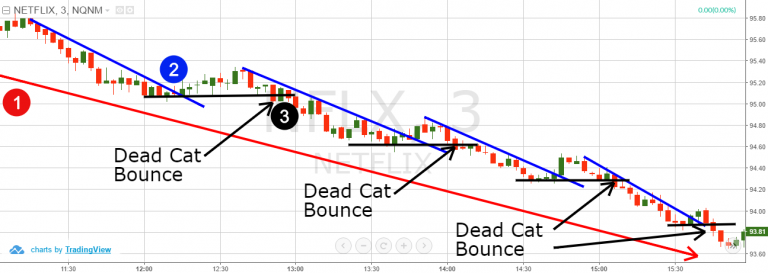
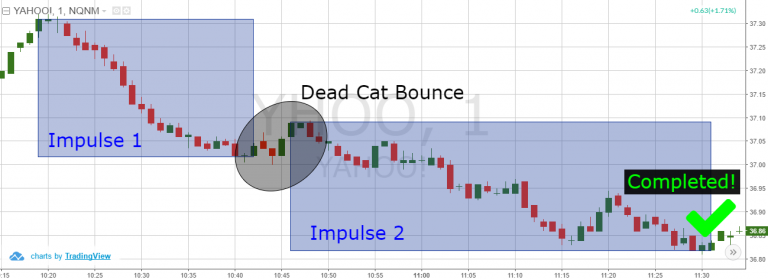
In the 3-minute chart of Netflix (NFLX) above, the blue lines represent a bearish downtrend that is broken by a dead cat bounce. The black horizontal lines mark a bottom just prior to it occuring.
- We first determine a strong bearish impulse on the NFLX chart that leads to an initial 1% drop.
- We observe the price breaking out in a bullish fashion
- The price finally reverses and breaks its last bottom.
The occurrence of these three events signals a bona fide dead cat bounce.
Trading on the Dead Cat Bounce Pattern
Timing is crucial when trading on a dead cat bounce. Once you identify one, you should short when the price action breaks below the last bottom.
Correct timing ensures that you profit as much as possible from a significant part of the price decrease. Bear in mind that dead cat reversals tend to be sharp and fast.
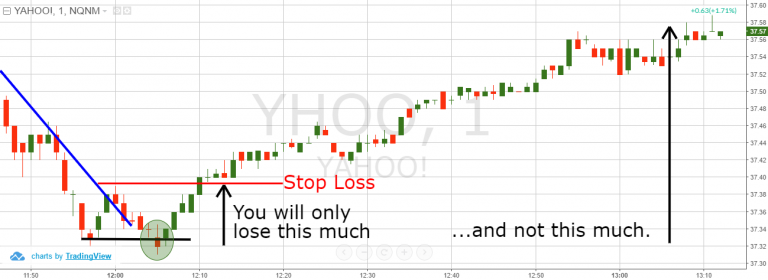
You should place a stop-loss order that is ideally slightly above the top of the pullback to minimize the trading risk. A simple continuation trade without a stop loss order can result in heavy losses.
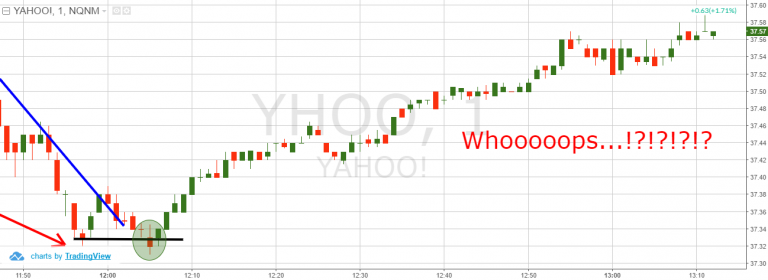
With a protective stop loss order, your losses become more manageable. In the chart above/below, the upturn lasted a whole hour and riding it to completion could have landed you in a world of pain.
In practice, the magnitude of the stop loss is determined by the share price and the volatility.
For instance, a 5-cent stop loss might be all right for a fairly volatile stock with a share price of $5 or $10, but makes little sense for another stock with a share price of $200 and high volatility.
You should therefore make adjustments to your stop loss order according to these key factors.
Taking profits
Once you identify this pattern on your charts, you should expect the next dead cat bounce to be at least of a similar magnitude.
With this knowledge, your profit target for the next impulse move should be equal in size to that of the prior range as indicated in the chart below:
 Source: TradingSim
In general, aim for a risk/reward ratio of at least 2:1. This means that if you place your stop loss $0.50 above your entry price, the profit target should be at least $1 below the entry price.
Bringing it all together
The chart below consolidates the various procedures required to trade the dead cat bounce:
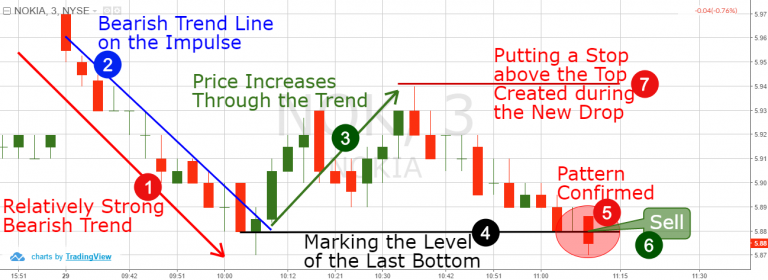 Source: TradingSim
If you’re itching for more, be sure and checkout the SteadyTrade Podcast. They cover the importance of pattern recognition, and why it’s so important for stock traders.
Always remember that timing is critical when trading a dead cat bounce. You should therefore short the stock the moment you see the first candle closing below the last low of the downtrend.