
The trading industry is based on data. Who gets the hottest tickers, numbers, and news FAST? You need to keep up.
Yes, you need Breaking News Chat and the fastest and best scans to find stocks. But I’m talking about the beginning of your trading journey…
Before you get into hot news plays and planning trades, you need data to learn from.
And it’s not just about tracking your trades and studying patterns.
You can take it to the next level…
By using technology to speed up your learning curve.
When you have to work and make it to other commitments you need to make the most of your study time. And you need data FAST!
Whether it’s learning how to read charts and level 2, or how to plan trades around key levels.
So today I’m sharing three ways you can track tickers and price action…
They might even help you spot a 165%+ gainer like we saw yesterday.
Three Ways to Get Data
When I started trading in the dark ages 15 years ago, I printed out charts in premarket so I could study them…
Then I’d go to work and run my business. And when I came home in the evening, I would print the entire intraday chart and compare it to the premarket one to see if I could spot patterns.
I was looking for anything that could help me recognize what might be a good runner. Then I could use what I learned on days I had time to trade.
But technology has come a long way since I started…
That means you can get more data, faster.
Screenshots
I often screenshot Oracle in the morning. Yesterday a SteadyTrade Team member noticed and asked me why I do it.
Basically, I want data.
I want to be able to look back at the Oracle levels it puts out in the morning and compare them to the end of the day. I want to see which stocks played out according to the plan and which ones didn’t.
I’m looking for any kind of edge I can give myself to pick out the best stocks to watch every morning.
So if I pick the wrong one, I want to look back and see if there was one that worked better and why.
That brought on a discussion about other tips SteadyTrade Team members use to give themselves an edge…
Now you can use screenshots to save charts instead of old-fashioned printing. But there’s something even better…
Screen Recording
If you have to leave for work, or even if you work near a computer but can’t watch charts all day — try screen recording.
There are a ton of free downloads you can get online.
Then you can record the chart of a stock you think has the potential to run — plus level 2 and time and sales — then you can re-watch it over and over to get a feel for price action.
You can build up a whole library of chart videos to watch.
And you can watch them at two or three times the speed … Talk about speeding up your learning curve.
If I can learn from printed charts, think how fast you can learn from watching the action in real time over and over.
And don’t just watch videos of stocks that go up. Record and watch failed patterns too. That way you can learn to recognize poor price action too.
Another faster way to track data is to have information delivered to you…
Dissect Experienced Traders’ Trade Plans
Yesterday I alerted Daily Market Profits subscribers to Nuwellis, Inc. (NASDAQ: NUWE) in premarket.
I gave the levels to enter and exit based on Oracle. And I gave reasons why this stock checked the boxes.
Because before you can make trading plans for yourself, you need data.
What makes a stock a good potential trade? And what does a good trading plan even look like?
That’s where I come in…
I search the stock’s float and check the volume. I sift through Breaking News Chat for news and chat pump alerts. Then Oracle gives me the levels…
And I give you all the information before the market even opens.
Yesterday my alert gave traders the chance to catch an almost 40% gain in half an hour.
And if you use StockToTrade, Oracle is included and it lays out the levels on the chart so your plan is right in front of you…
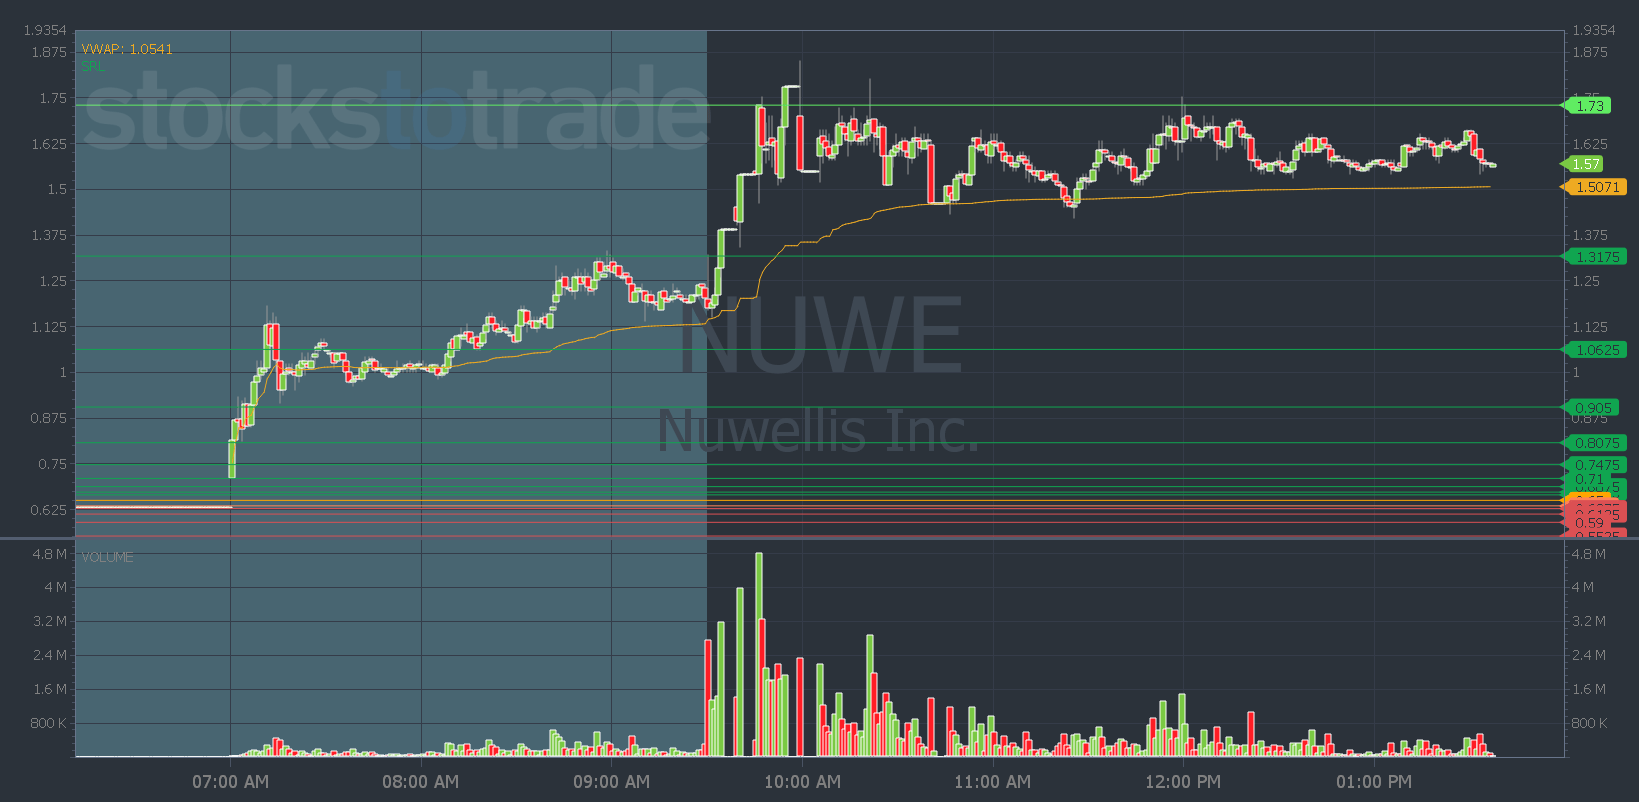
Just trade between the support and resistance lines.
I can’t guarantee all my trade ideas will work. That’s not realistic.
But I’ll send you a pick and trade plan right to your inbox every morning so you can build your data bank…
Then you can go back, study them, and compare them to the chart.
Use the alerts and charts to decipher why I picked that stock, what Oracle liked about the levels, and why the setup worked or didn’t.
Every day in the markets is a learning opportunity. Whether you win, lose, or sit on the sidelines…
Just work at getting 1% better every day.
Have a great day everyone. See you all back here tomorrow.
Tim Bohen
Lead Trainer, StocksToTrade